Yuman vs Icelander Per Capita Income
COMPARE
Yuman
Icelander
Per Capita Income
Per Capita Income Comparison
Yuman
Icelanders
$33,236
PER CAPITA INCOME
0.0/ 100
METRIC RATING
335th/ 347
METRIC RANK
$44,987
PER CAPITA INCOME
81.6/ 100
METRIC RATING
144th/ 347
METRIC RANK
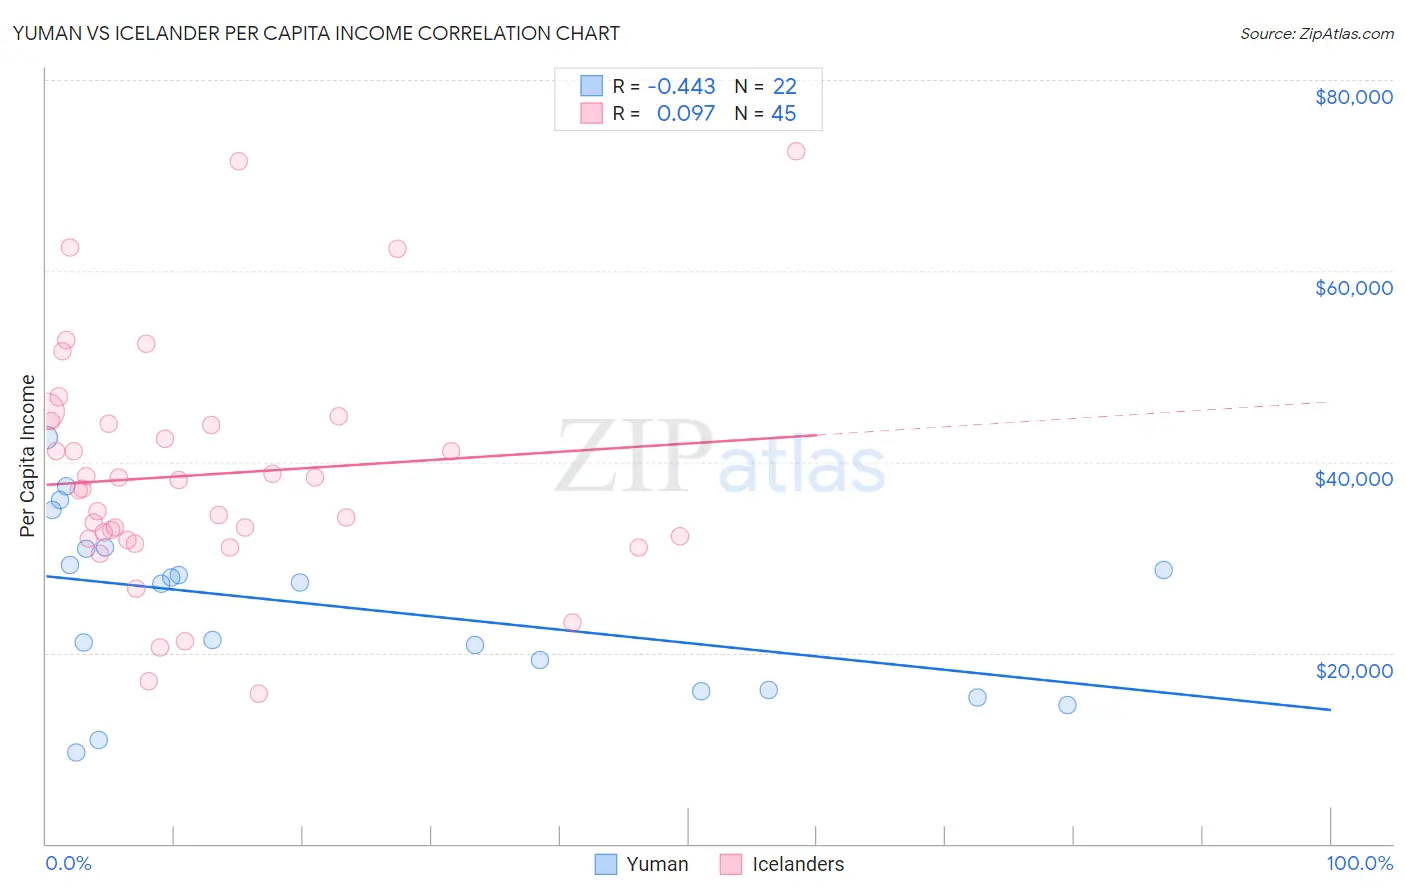
Yuman vs Icelander Per Capita Income Correlation Chart
The statistical analysis conducted on geographies consisting of 40,696,310 people shows a moderate negative correlation between the proportion of Yuman and per capita income in the United States with a correlation coefficient (R) of -0.443 and weighted average of $33,236. Similarly, the statistical analysis conducted on geographies consisting of 159,668,759 people shows a slight positive correlation between the proportion of Icelanders and per capita income in the United States with a correlation coefficient (R) of 0.097 and weighted average of $44,987, a difference of 35.4%.
Per Capita Income Correlation Summary
| Measurement | Yuman | Icelander |
| Minimum | $9,533 | $15,711 |
| Maximum | $42,569 | $72,483 |
| Range | $33,036 | $56,772 |
| Mean | $24,831 | $38,667 |
| Median | $27,284 | $37,248 |
| Interquartile 25% (IQ1) | $16,137 | $31,880 |
| Interquartile 75% (IQ3) | $30,879 | $44,123 |
| Interquartile Range (IQR) | $14,742 | $12,243 |
| Standard Deviation (Sample) | $8,979 | $12,398 |
| Standard Deviation (Population) | $8,772 | $12,260 |
Similar Demographics by Per Capita Income
Demographics Similar to Yuman by Per Capita Income
In terms of per capita income, the demographic groups most similar to Yuman are Native/Alaskan ($33,279, a difference of 0.13%), Yakama ($33,009, a difference of 0.69%), Houma ($32,996, a difference of 0.73%), Immigrants from Yemen ($33,696, a difference of 1.4%), and Sioux ($33,921, a difference of 2.1%).
| Demographics | Rating | Rank | Per Capita Income |
| Menominee | 0.0 /100 | #328 | Tragic $34,578 |
| Mexicans | 0.0 /100 | #329 | Tragic $34,559 |
| Spanish American Indians | 0.0 /100 | #330 | Tragic $34,195 |
| Immigrants | Mexico | 0.0 /100 | #331 | Tragic $33,931 |
| Sioux | 0.0 /100 | #332 | Tragic $33,921 |
| Immigrants | Yemen | 0.0 /100 | #333 | Tragic $33,696 |
| Natives/Alaskans | 0.0 /100 | #334 | Tragic $33,279 |
| Yuman | 0.0 /100 | #335 | Tragic $33,236 |
| Yakama | 0.0 /100 | #336 | Tragic $33,009 |
| Houma | 0.0 /100 | #337 | Tragic $32,996 |
| Arapaho | 0.0 /100 | #338 | Tragic $32,345 |
| Pueblo | 0.0 /100 | #339 | Tragic $32,012 |
| Crow | 0.0 /100 | #340 | Tragic $31,729 |
| Puerto Ricans | 0.0 /100 | #341 | Tragic $31,268 |
| Hopi | 0.0 /100 | #342 | Tragic $31,177 |
Demographics Similar to Icelanders by Per Capita Income
In terms of per capita income, the demographic groups most similar to Icelanders are Immigrants from Uganda ($45,043, a difference of 0.12%), Ugandan ($45,047, a difference of 0.13%), Slavic ($45,049, a difference of 0.14%), Immigrants from Jordan ($45,066, a difference of 0.18%), and Basque ($45,086, a difference of 0.22%).
| Demographics | Rating | Rank | Per Capita Income |
| Immigrants | Syria | 85.2 /100 | #137 | Excellent $45,218 |
| Assyrians/Chaldeans/Syriacs | 84.8 /100 | #138 | Excellent $45,195 |
| Basques | 83.2 /100 | #139 | Excellent $45,086 |
| Immigrants | Jordan | 82.9 /100 | #140 | Excellent $45,066 |
| Slavs | 82.6 /100 | #141 | Excellent $45,049 |
| Ugandans | 82.6 /100 | #142 | Excellent $45,047 |
| Immigrants | Uganda | 82.5 /100 | #143 | Excellent $45,043 |
| Icelanders | 81.6 /100 | #144 | Excellent $44,987 |
| Immigrants | Afghanistan | 78.0 /100 | #145 | Good $44,790 |
| Irish | 75.8 /100 | #146 | Good $44,679 |
| Czechs | 74.1 /100 | #147 | Good $44,595 |
| Immigrants | Armenia | 73.1 /100 | #148 | Good $44,552 |
| Koreans | 72.5 /100 | #149 | Good $44,522 |
| Immigrants | Eritrea | 72.1 /100 | #150 | Good $44,509 |
| Norwegians | 71.5 /100 | #151 | Good $44,480 |