Yuman vs Immigrants from Romania Currently Married
COMPARE
Yuman
Immigrants from Romania
Currently Married
Currently Married Comparison
Yuman
Immigrants from Romania
42.6%
CURRENTLY MARRIED
0.0/ 100
METRIC RATING
293rd/ 347
METRIC RANK
48.4%
CURRENTLY MARRIED
98.5/ 100
METRIC RATING
60th/ 347
METRIC RANK
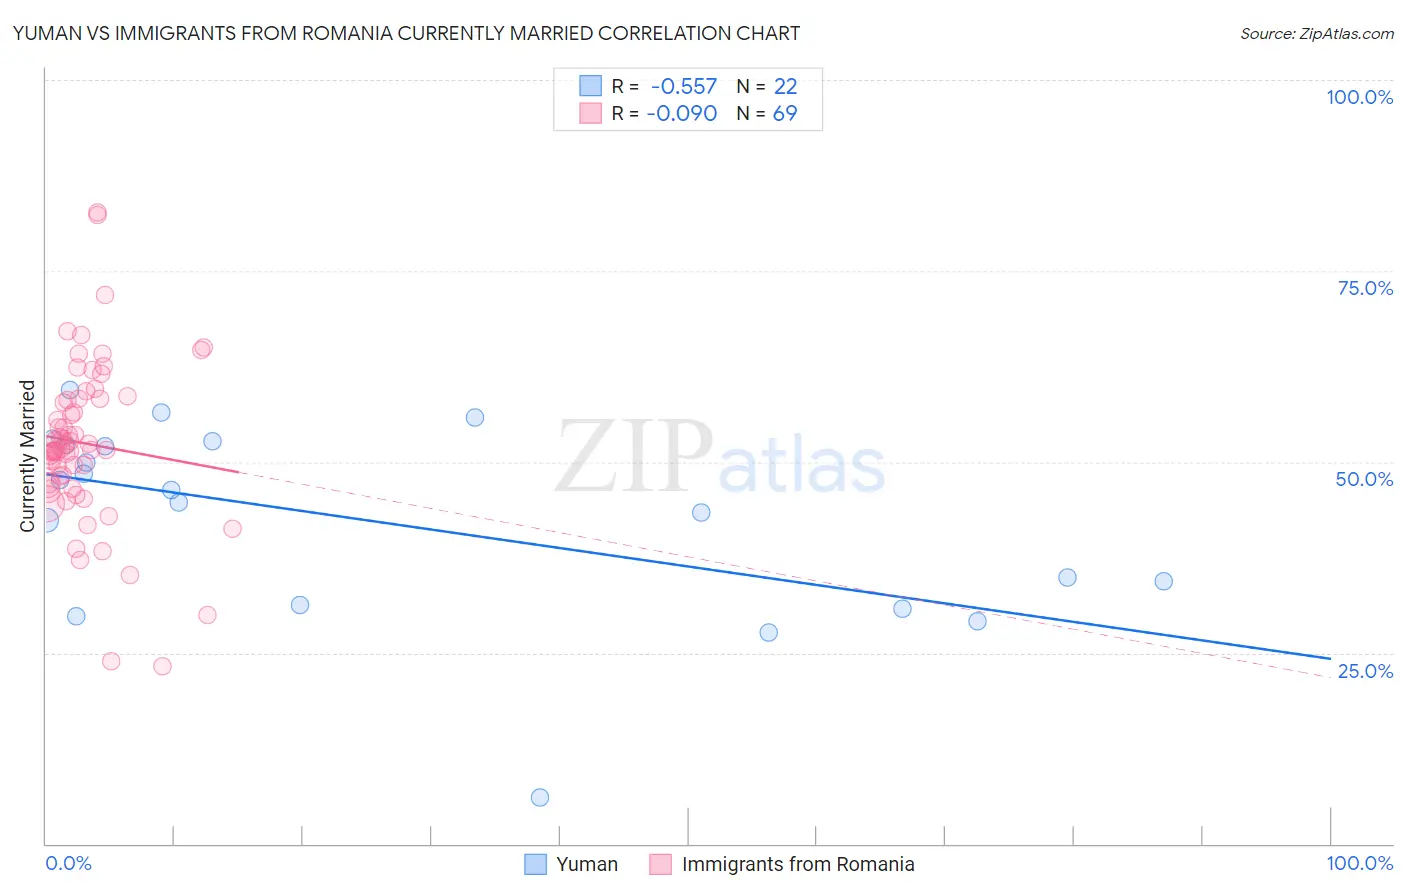
Yuman vs Immigrants from Romania Currently Married Correlation Chart
The statistical analysis conducted on geographies consisting of 40,696,202 people shows a substantial negative correlation between the proportion of Yuman and percentage of population currently married in the United States with a correlation coefficient (R) of -0.557 and weighted average of 42.6%. Similarly, the statistical analysis conducted on geographies consisting of 257,009,333 people shows a slight negative correlation between the proportion of Immigrants from Romania and percentage of population currently married in the United States with a correlation coefficient (R) of -0.090 and weighted average of 48.4%, a difference of 13.7%.
Currently Married Correlation Summary
| Measurement | Yuman | Immigrants from Romania |
| Minimum | 6.1% | 23.2% |
| Maximum | 59.4% | 82.6% |
| Range | 53.3% | 59.4% |
| Mean | 42.2% | 52.4% |
| Median | 45.5% | 51.6% |
| Interquartile 25% (IQ1) | 31.2% | 47.1% |
| Interquartile 75% (IQ3) | 52.2% | 58.3% |
| Interquartile Range (IQR) | 21.0% | 11.2% |
| Standard Deviation (Sample) | 12.8% | 10.7% |
| Standard Deviation (Population) | 12.5% | 10.6% |
Similar Demographics by Currently Married
Demographics Similar to Yuman by Currently Married
In terms of currently married, the demographic groups most similar to Yuman are Subsaharan African (42.6%, a difference of 0.020%), Honduran (42.5%, a difference of 0.12%), Immigrants from Guatemala (42.6%, a difference of 0.18%), Immigrants from Ghana (42.7%, a difference of 0.29%), and Paiute (42.7%, a difference of 0.30%).
| Demographics | Rating | Rank | Currently Married |
| Ghanaians | 0.0 /100 | #286 | Tragic 42.9% |
| Guatemalans | 0.0 /100 | #287 | Tragic 42.9% |
| Natives/Alaskans | 0.0 /100 | #288 | Tragic 42.8% |
| Paiute | 0.0 /100 | #289 | Tragic 42.7% |
| Immigrants | Ghana | 0.0 /100 | #290 | Tragic 42.7% |
| Immigrants | Guatemala | 0.0 /100 | #291 | Tragic 42.6% |
| Sub-Saharan Africans | 0.0 /100 | #292 | Tragic 42.6% |
| Yuman | 0.0 /100 | #293 | Tragic 42.6% |
| Hondurans | 0.0 /100 | #294 | Tragic 42.5% |
| Immigrants | Western Africa | 0.0 /100 | #295 | Tragic 42.4% |
| Menominee | 0.0 /100 | #296 | Tragic 42.3% |
| Cheyenne | 0.0 /100 | #297 | Tragic 42.2% |
| Immigrants | Honduras | 0.0 /100 | #298 | Tragic 42.2% |
| Liberians | 0.0 /100 | #299 | Tragic 42.2% |
| Belizeans | 0.0 /100 | #300 | Tragic 42.2% |
Demographics Similar to Immigrants from Romania by Currently Married
In terms of currently married, the demographic groups most similar to Immigrants from Romania are Immigrants from Ireland (48.4%, a difference of 0.010%), Romanian (48.4%, a difference of 0.010%), Asian (48.4%, a difference of 0.010%), French (48.4%, a difference of 0.040%), and Immigrants from Netherlands (48.5%, a difference of 0.090%).
| Demographics | Rating | Rank | Currently Married |
| Immigrants | Austria | 98.8 /100 | #53 | Exceptional 48.5% |
| Immigrants | Moldova | 98.7 /100 | #54 | Exceptional 48.5% |
| Immigrants | North Macedonia | 98.7 /100 | #55 | Exceptional 48.5% |
| Latvians | 98.7 /100 | #56 | Exceptional 48.5% |
| Immigrants | Netherlands | 98.6 /100 | #57 | Exceptional 48.5% |
| French | 98.6 /100 | #58 | Exceptional 48.4% |
| Immigrants | Ireland | 98.5 /100 | #59 | Exceptional 48.4% |
| Immigrants | Romania | 98.5 /100 | #60 | Exceptional 48.4% |
| Romanians | 98.5 /100 | #61 | Exceptional 48.4% |
| Asians | 98.5 /100 | #62 | Exceptional 48.4% |
| Slavs | 98.3 /100 | #63 | Exceptional 48.4% |
| Immigrants | Czechoslovakia | 98.3 /100 | #64 | Exceptional 48.4% |
| Ukrainians | 98.3 /100 | #65 | Exceptional 48.4% |
| Tongans | 98.2 /100 | #66 | Exceptional 48.3% |
| Slovaks | 98.2 /100 | #67 | Exceptional 48.3% |