Yuman vs Celtic Householder Income Under 25 years
COMPARE
Yuman
Celtic
Householder Income Under 25 years
Householder Income Under 25 years Comparison
Yuman
Celtics
$50,933
HOUSEHOLDER INCOME UNDER 25 YEARS
4.4/ 100
METRIC RATING
229th/ 347
METRIC RANK
$50,447
HOUSEHOLDER INCOME UNDER 25 YEARS
1.4/ 100
METRIC RATING
251st/ 347
METRIC RANK
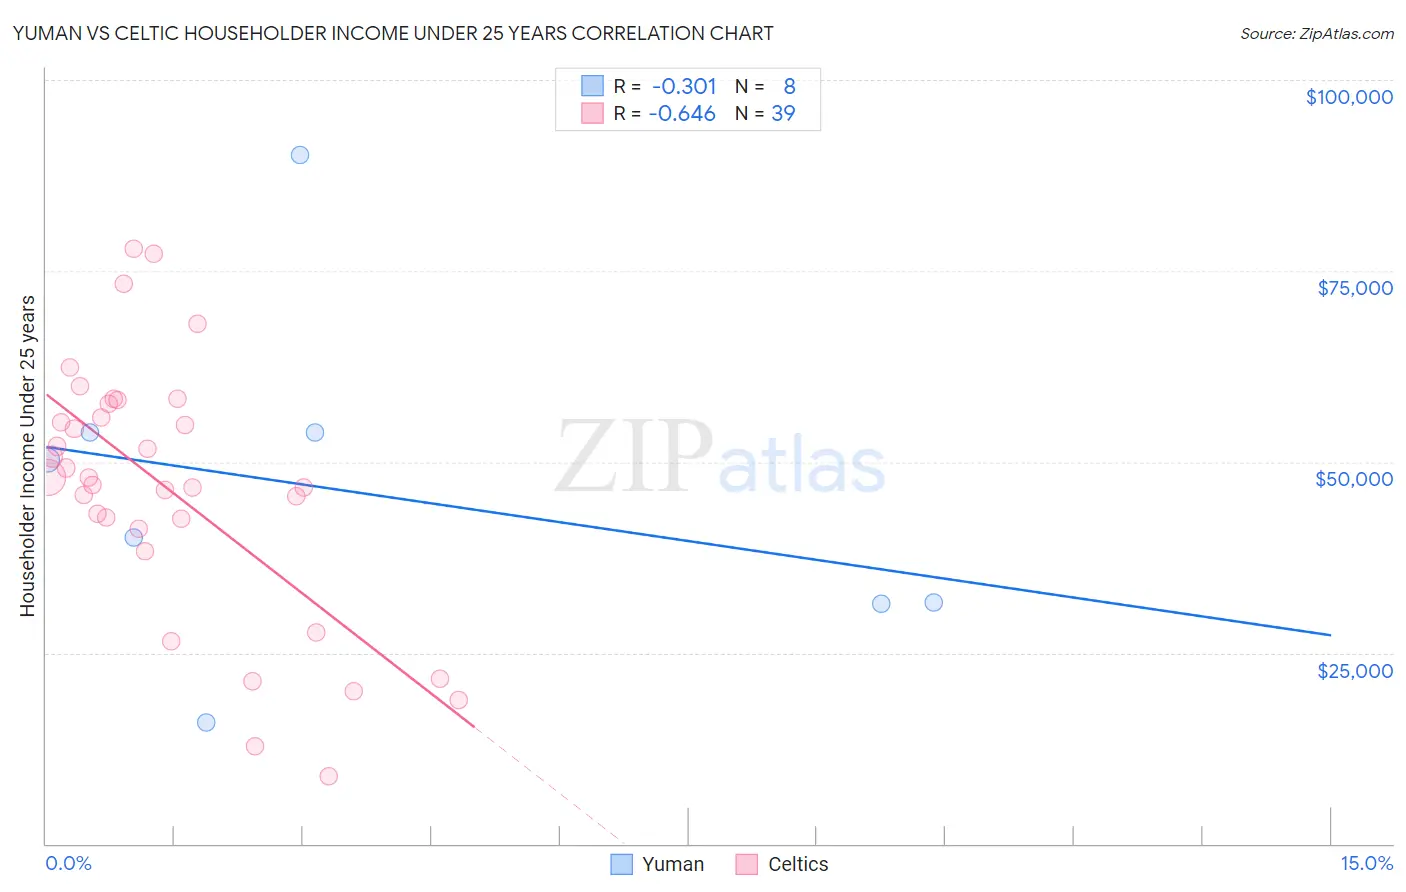
Yuman vs Celtic Householder Income Under 25 years Correlation Chart
The statistical analysis conducted on geographies consisting of 39,381,315 people shows a mild negative correlation between the proportion of Yuman and household income with householder under the age of 25 in the United States with a correlation coefficient (R) of -0.301 and weighted average of $50,933. Similarly, the statistical analysis conducted on geographies consisting of 153,501,532 people shows a significant negative correlation between the proportion of Celtics and household income with householder under the age of 25 in the United States with a correlation coefficient (R) of -0.646 and weighted average of $50,447, a difference of 0.96%.
Householder Income Under 25 years Correlation Summary
| Measurement | Yuman | Celtic |
| Minimum | $15,893 | $8,850 |
| Maximum | $90,217 | $77,857 |
| Range | $74,324 | $69,007 |
| Mean | $45,866 | $46,502 |
| Median | $45,161 | $47,888 |
| Interquartile 25% (IQ1) | $31,448 | $41,319 |
| Interquartile 75% (IQ3) | $53,802 | $57,577 |
| Interquartile Range (IQR) | $22,354 | $16,258 |
| Standard Deviation (Sample) | $22,232 | $16,722 |
| Standard Deviation (Population) | $20,796 | $16,506 |
Similar Demographics by Householder Income Under 25 years
Demographics Similar to Yuman by Householder Income Under 25 years
In terms of householder income under 25 years, the demographic groups most similar to Yuman are Jamaican ($50,929, a difference of 0.010%), Ugandan ($50,923, a difference of 0.020%), Slovene ($50,886, a difference of 0.090%), Immigrants from Norway ($50,984, a difference of 0.10%), and Pennsylvania German ($50,852, a difference of 0.16%).
| Demographics | Rating | Rank | Householder Income Under 25 years |
| Spaniards | 6.8 /100 | #222 | Tragic $51,117 |
| Serbians | 6.6 /100 | #223 | Tragic $51,106 |
| Belizeans | 6.4 /100 | #224 | Tragic $51,094 |
| Immigrants | Jamaica | 5.6 /100 | #225 | Tragic $51,038 |
| Yugoslavians | 5.5 /100 | #226 | Tragic $51,028 |
| Immigrants | Central America | 5.4 /100 | #227 | Tragic $51,022 |
| Immigrants | Norway | 5.0 /100 | #228 | Tragic $50,984 |
| Yuman | 4.4 /100 | #229 | Tragic $50,933 |
| Jamaicans | 4.4 /100 | #230 | Tragic $50,929 |
| Ugandans | 4.3 /100 | #231 | Tragic $50,923 |
| Slovenes | 4.0 /100 | #232 | Tragic $50,886 |
| Pennsylvania Germans | 3.7 /100 | #233 | Tragic $50,852 |
| Kenyans | 3.3 /100 | #234 | Tragic $50,815 |
| Spanish | 3.3 /100 | #235 | Tragic $50,813 |
| English | 3.3 /100 | #236 | Tragic $50,805 |
Demographics Similar to Celtics by Householder Income Under 25 years
In terms of householder income under 25 years, the demographic groups most similar to Celtics are Immigrants from Mexico ($50,422, a difference of 0.050%), Immigrants from Haiti ($50,398, a difference of 0.10%), Luxembourger ($50,379, a difference of 0.13%), Immigrants from Cabo Verde ($50,520, a difference of 0.14%), and Aleut ($50,377, a difference of 0.14%).
| Demographics | Rating | Rank | Householder Income Under 25 years |
| Marshallese | 2.1 /100 | #244 | Tragic $50,627 |
| Immigrants | Africa | 2.0 /100 | #245 | Tragic $50,609 |
| Welsh | 2.0 /100 | #246 | Tragic $50,597 |
| Immigrants | Bosnia and Herzegovina | 1.8 /100 | #247 | Tragic $50,565 |
| Slavs | 1.8 /100 | #248 | Tragic $50,563 |
| Scottish | 1.8 /100 | #249 | Tragic $50,554 |
| Immigrants | Cabo Verde | 1.7 /100 | #250 | Tragic $50,520 |
| Celtics | 1.4 /100 | #251 | Tragic $50,447 |
| Immigrants | Mexico | 1.3 /100 | #252 | Tragic $50,422 |
| Immigrants | Haiti | 1.2 /100 | #253 | Tragic $50,398 |
| Luxembourgers | 1.2 /100 | #254 | Tragic $50,379 |
| Aleuts | 1.2 /100 | #255 | Tragic $50,377 |
| Immigrants | Cuba | 1.2 /100 | #256 | Tragic $50,374 |
| Lebanese | 1.1 /100 | #257 | Tragic $50,355 |
| Whites/Caucasians | 1.1 /100 | #258 | Tragic $50,336 |