Immigrants from Northern Europe vs Celtic Householder Income Under 25 years
COMPARE
Immigrants from Northern Europe
Celtic
Householder Income Under 25 years
Householder Income Under 25 years Comparison
Immigrants from Northern Europe
Celtics
$54,571
HOUSEHOLDER INCOME UNDER 25 YEARS
99.7/ 100
METRIC RATING
72nd/ 347
METRIC RANK
$50,447
HOUSEHOLDER INCOME UNDER 25 YEARS
1.4/ 100
METRIC RATING
251st/ 347
METRIC RANK
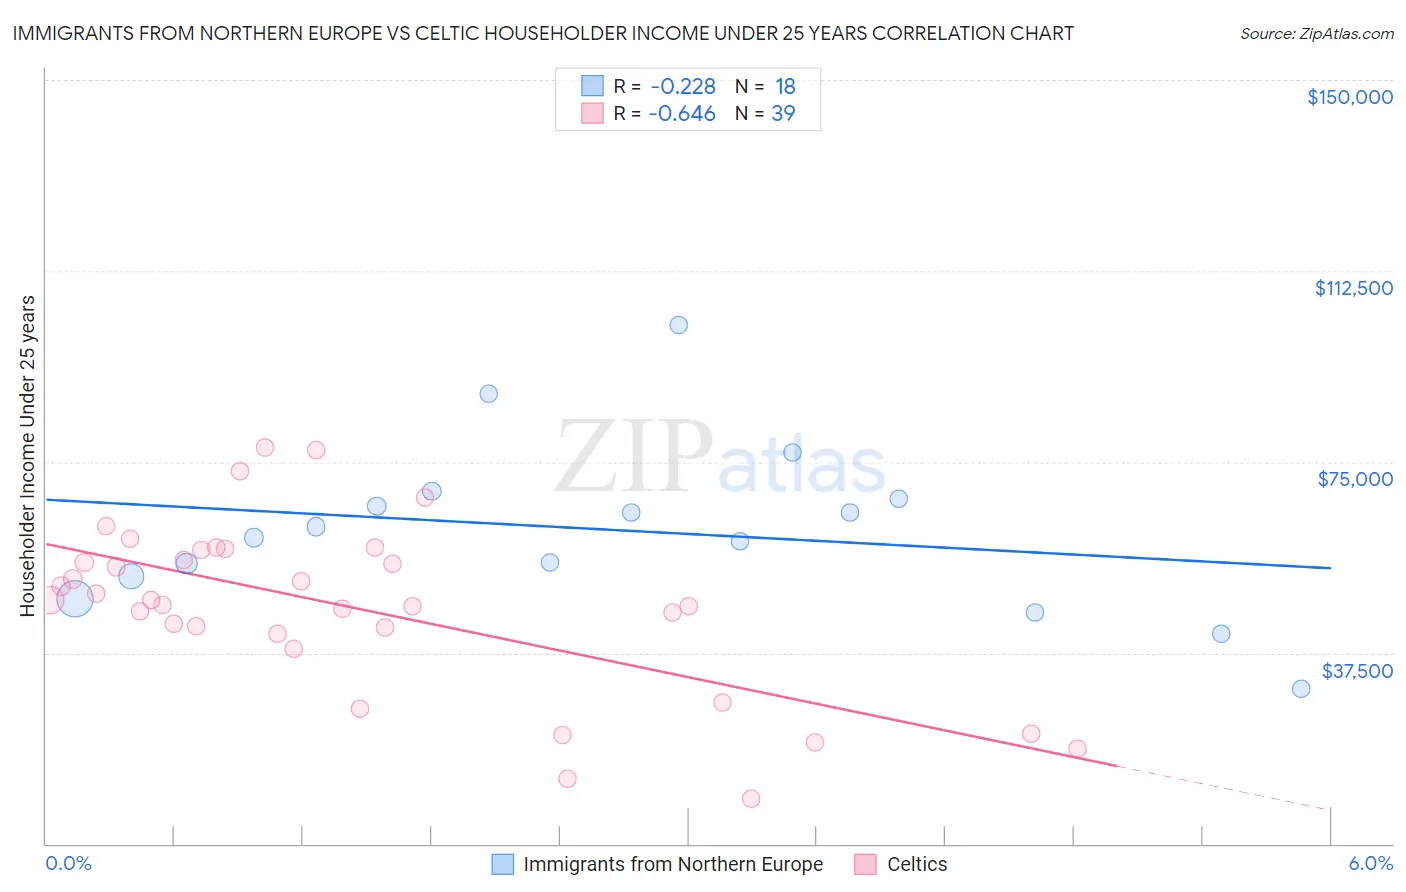
Immigrants from Northern Europe vs Celtic Householder Income Under 25 years Correlation Chart
The statistical analysis conducted on geographies consisting of 387,569,544 people shows a weak negative correlation between the proportion of Immigrants from Northern Europe and household income with householder under the age of 25 in the United States with a correlation coefficient (R) of -0.228 and weighted average of $54,571. Similarly, the statistical analysis conducted on geographies consisting of 153,501,532 people shows a significant negative correlation between the proportion of Celtics and household income with householder under the age of 25 in the United States with a correlation coefficient (R) of -0.646 and weighted average of $50,447, a difference of 8.2%.
Householder Income Under 25 years Correlation Summary
| Measurement | Immigrants from Northern Europe | Celtic |
| Minimum | $30,455 | $8,850 |
| Maximum | $101,975 | $77,857 |
| Range | $71,520 | $69,007 |
| Mean | $61,689 | $46,502 |
| Median | $61,171 | $47,888 |
| Interquartile 25% (IQ1) | $52,438 | $41,319 |
| Interquartile 75% (IQ3) | $67,748 | $57,577 |
| Interquartile Range (IQR) | $15,310 | $16,258 |
| Standard Deviation (Sample) | $16,674 | $16,722 |
| Standard Deviation (Population) | $16,204 | $16,506 |
Similar Demographics by Householder Income Under 25 years
Demographics Similar to Immigrants from Northern Europe by Householder Income Under 25 years
In terms of householder income under 25 years, the demographic groups most similar to Immigrants from Northern Europe are Macedonian ($54,563, a difference of 0.020%), Immigrants from Morocco ($54,593, a difference of 0.040%), Immigrants from El Salvador ($54,599, a difference of 0.050%), Immigrants from Grenada ($54,538, a difference of 0.060%), and Samoan ($54,610, a difference of 0.070%).
| Demographics | Rating | Rank | Householder Income Under 25 years |
| Yup'ik | 99.8 /100 | #65 | Exceptional $54,732 |
| Immigrants | Bangladesh | 99.8 /100 | #66 | Exceptional $54,714 |
| Okinawans | 99.8 /100 | #67 | Exceptional $54,701 |
| Tsimshian | 99.8 /100 | #68 | Exceptional $54,649 |
| Samoans | 99.7 /100 | #69 | Exceptional $54,610 |
| Immigrants | El Salvador | 99.7 /100 | #70 | Exceptional $54,599 |
| Immigrants | Morocco | 99.7 /100 | #71 | Exceptional $54,593 |
| Immigrants | Northern Europe | 99.7 /100 | #72 | Exceptional $54,571 |
| Macedonians | 99.7 /100 | #73 | Exceptional $54,563 |
| Immigrants | Grenada | 99.7 /100 | #74 | Exceptional $54,538 |
| Immigrants | Sri Lanka | 99.7 /100 | #75 | Exceptional $54,512 |
| Immigrants | Brazil | 99.6 /100 | #76 | Exceptional $54,487 |
| Immigrants | Southern Europe | 99.6 /100 | #77 | Exceptional $54,484 |
| Nepalese | 99.6 /100 | #78 | Exceptional $54,472 |
| Immigrants | Italy | 99.6 /100 | #79 | Exceptional $54,449 |
Demographics Similar to Celtics by Householder Income Under 25 years
In terms of householder income under 25 years, the demographic groups most similar to Celtics are Immigrants from Mexico ($50,422, a difference of 0.050%), Immigrants from Haiti ($50,398, a difference of 0.10%), Luxembourger ($50,379, a difference of 0.13%), Immigrants from Cabo Verde ($50,520, a difference of 0.14%), and Aleut ($50,377, a difference of 0.14%).
| Demographics | Rating | Rank | Householder Income Under 25 years |
| Marshallese | 2.1 /100 | #244 | Tragic $50,627 |
| Immigrants | Africa | 2.0 /100 | #245 | Tragic $50,609 |
| Welsh | 2.0 /100 | #246 | Tragic $50,597 |
| Immigrants | Bosnia and Herzegovina | 1.8 /100 | #247 | Tragic $50,565 |
| Slavs | 1.8 /100 | #248 | Tragic $50,563 |
| Scottish | 1.8 /100 | #249 | Tragic $50,554 |
| Immigrants | Cabo Verde | 1.7 /100 | #250 | Tragic $50,520 |
| Celtics | 1.4 /100 | #251 | Tragic $50,447 |
| Immigrants | Mexico | 1.3 /100 | #252 | Tragic $50,422 |
| Immigrants | Haiti | 1.2 /100 | #253 | Tragic $50,398 |
| Luxembourgers | 1.2 /100 | #254 | Tragic $50,379 |
| Aleuts | 1.2 /100 | #255 | Tragic $50,377 |
| Immigrants | Cuba | 1.2 /100 | #256 | Tragic $50,374 |
| Lebanese | 1.1 /100 | #257 | Tragic $50,355 |
| Whites/Caucasians | 1.1 /100 | #258 | Tragic $50,336 |