English vs Celtic Householder Income Under 25 years
COMPARE
English
Celtic
Householder Income Under 25 years
Householder Income Under 25 years Comparison
English
Celtics
$50,805
HOUSEHOLDER INCOME UNDER 25 YEARS
3.3/ 100
METRIC RATING
236th/ 347
METRIC RANK
$50,447
HOUSEHOLDER INCOME UNDER 25 YEARS
1.4/ 100
METRIC RATING
251st/ 347
METRIC RANK
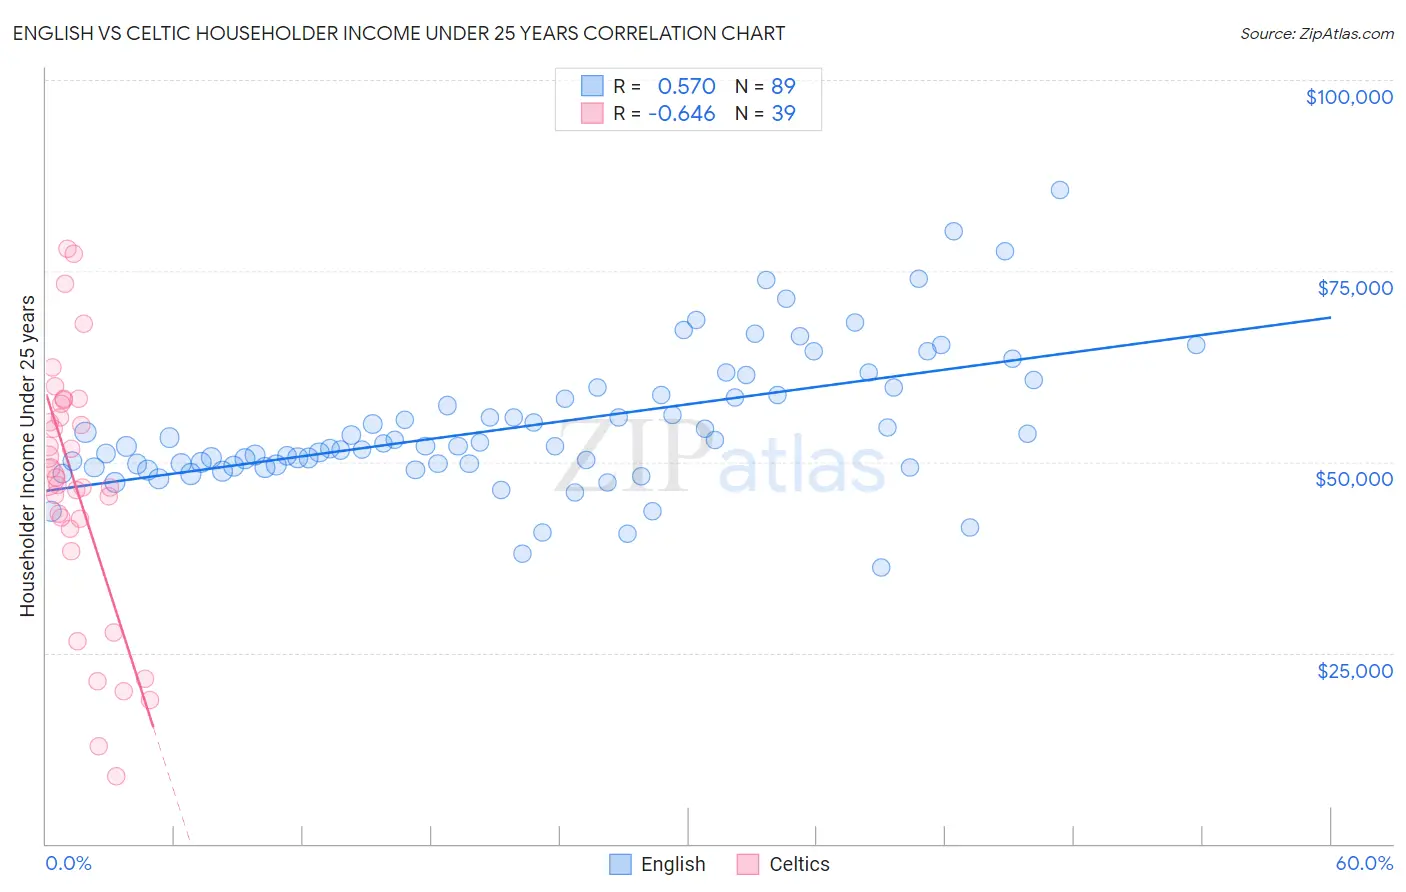
English vs Celtic Householder Income Under 25 years Correlation Chart
The statistical analysis conducted on geographies consisting of 440,590,191 people shows a substantial positive correlation between the proportion of English and household income with householder under the age of 25 in the United States with a correlation coefficient (R) of 0.570 and weighted average of $50,805. Similarly, the statistical analysis conducted on geographies consisting of 153,501,532 people shows a significant negative correlation between the proportion of Celtics and household income with householder under the age of 25 in the United States with a correlation coefficient (R) of -0.646 and weighted average of $50,447, a difference of 0.71%.
Householder Income Under 25 years Correlation Summary
| Measurement | English | Celtic |
| Minimum | $36,250 | $8,850 |
| Maximum | $85,625 | $77,857 |
| Range | $49,375 | $69,007 |
| Mean | $54,811 | $46,502 |
| Median | $52,083 | $47,888 |
| Interquartile 25% (IQ1) | $49,480 | $41,319 |
| Interquartile 75% (IQ3) | $59,272 | $57,577 |
| Interquartile Range (IQR) | $9,791 | $16,258 |
| Standard Deviation (Sample) | $9,060 | $16,722 |
| Standard Deviation (Population) | $9,009 | $16,506 |
Demographics Similar to English and Celtics by Householder Income Under 25 years
In terms of householder income under 25 years, the demographic groups most similar to English are German ($50,804, a difference of 0.0%), Iraqi ($50,802, a difference of 0.010%), Kenyan ($50,815, a difference of 0.020%), Spanish ($50,813, a difference of 0.020%), and Pennsylvania German ($50,852, a difference of 0.090%). Similarly, the demographic groups most similar to Celtics are Immigrants from Mexico ($50,422, a difference of 0.050%), Immigrants from Haiti ($50,398, a difference of 0.10%), Immigrants from Cabo Verde ($50,520, a difference of 0.14%), Scottish ($50,554, a difference of 0.21%), and Immigrants from Bosnia and Herzegovina ($50,565, a difference of 0.23%).
| Demographics | Rating | Rank | Householder Income Under 25 years |
| Pennsylvania Germans | 3.7 /100 | #233 | Tragic $50,852 |
| Kenyans | 3.3 /100 | #234 | Tragic $50,815 |
| Spanish | 3.3 /100 | #235 | Tragic $50,813 |
| English | 3.3 /100 | #236 | Tragic $50,805 |
| Germans | 3.3 /100 | #237 | Tragic $50,804 |
| Iraqis | 3.2 /100 | #238 | Tragic $50,802 |
| Immigrants | Caribbean | 2.9 /100 | #239 | Tragic $50,757 |
| Immigrants | Lebanon | 2.7 /100 | #240 | Tragic $50,729 |
| Immigrants | Micronesia | 2.5 /100 | #241 | Tragic $50,691 |
| Cubans | 2.3 /100 | #242 | Tragic $50,655 |
| Immigrants | Thailand | 2.2 /100 | #243 | Tragic $50,645 |
| Marshallese | 2.1 /100 | #244 | Tragic $50,627 |
| Immigrants | Africa | 2.0 /100 | #245 | Tragic $50,609 |
| Welsh | 2.0 /100 | #246 | Tragic $50,597 |
| Immigrants | Bosnia and Herzegovina | 1.8 /100 | #247 | Tragic $50,565 |
| Slavs | 1.8 /100 | #248 | Tragic $50,563 |
| Scottish | 1.8 /100 | #249 | Tragic $50,554 |
| Immigrants | Cabo Verde | 1.7 /100 | #250 | Tragic $50,520 |
| Celtics | 1.4 /100 | #251 | Tragic $50,447 |
| Immigrants | Mexico | 1.3 /100 | #252 | Tragic $50,422 |
| Immigrants | Haiti | 1.2 /100 | #253 | Tragic $50,398 |