Creek vs Celtic Householder Income Under 25 years
COMPARE
Creek
Celtic
Householder Income Under 25 years
Householder Income Under 25 years Comparison
Creek
Celtics
$45,371
HOUSEHOLDER INCOME UNDER 25 YEARS
0.0/ 100
METRIC RATING
333rd/ 347
METRIC RANK
$50,447
HOUSEHOLDER INCOME UNDER 25 YEARS
1.4/ 100
METRIC RATING
251st/ 347
METRIC RANK
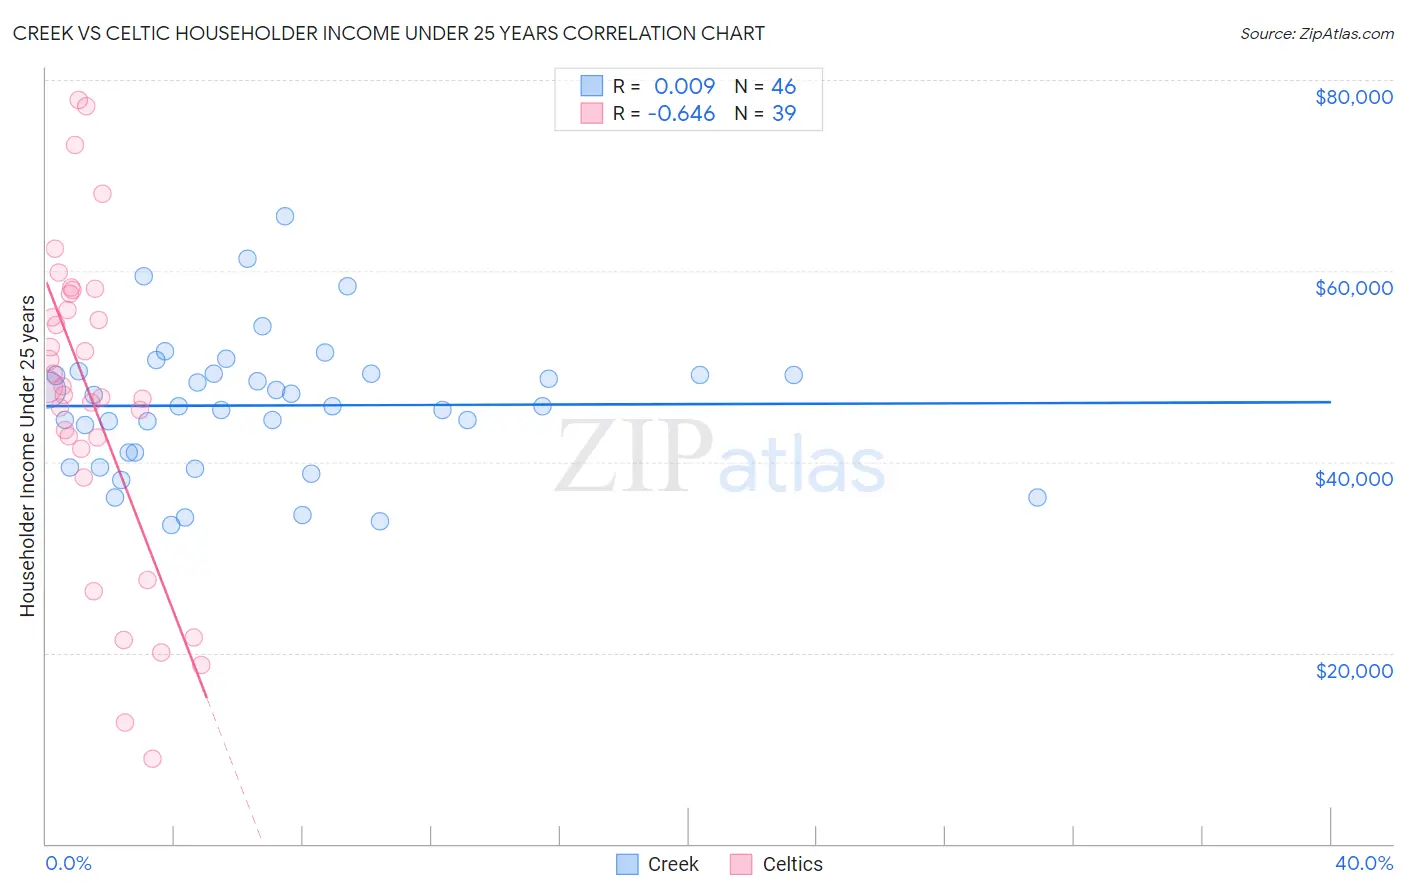
Creek vs Celtic Householder Income Under 25 years Correlation Chart
The statistical analysis conducted on geographies consisting of 164,397,221 people shows no correlation between the proportion of Creek and household income with householder under the age of 25 in the United States with a correlation coefficient (R) of 0.009 and weighted average of $45,371. Similarly, the statistical analysis conducted on geographies consisting of 153,501,532 people shows a significant negative correlation between the proportion of Celtics and household income with householder under the age of 25 in the United States with a correlation coefficient (R) of -0.646 and weighted average of $50,447, a difference of 11.2%.
Householder Income Under 25 years Correlation Summary
| Measurement | Creek | Celtic |
| Minimum | $33,336 | $8,850 |
| Maximum | $65,786 | $77,857 |
| Range | $32,449 | $69,007 |
| Mean | $45,917 | $46,502 |
| Median | $45,833 | $47,888 |
| Interquartile 25% (IQ1) | $40,947 | $41,319 |
| Interquartile 75% (IQ3) | $49,244 | $57,577 |
| Interquartile Range (IQR) | $8,297 | $16,258 |
| Standard Deviation (Sample) | $7,169 | $16,722 |
| Standard Deviation (Population) | $7,091 | $16,506 |
Similar Demographics by Householder Income Under 25 years
Demographics Similar to Creek by Householder Income Under 25 years
In terms of householder income under 25 years, the demographic groups most similar to Creek are Cajun ($45,338, a difference of 0.070%), Choctaw ($45,450, a difference of 0.17%), Cheyenne ($45,275, a difference of 0.21%), Tohono O'odham ($45,248, a difference of 0.27%), and Immigrants from Zaire ($45,529, a difference of 0.35%).
| Demographics | Rating | Rank | Householder Income Under 25 years |
| Osage | 0.0 /100 | #326 | Tragic $45,764 |
| Bahamians | 0.0 /100 | #327 | Tragic $45,743 |
| German Russians | 0.0 /100 | #328 | Tragic $45,673 |
| Seminole | 0.0 /100 | #329 | Tragic $45,649 |
| Indonesians | 0.0 /100 | #330 | Tragic $45,566 |
| Immigrants | Zaire | 0.0 /100 | #331 | Tragic $45,529 |
| Choctaw | 0.0 /100 | #332 | Tragic $45,450 |
| Creek | 0.0 /100 | #333 | Tragic $45,371 |
| Cajuns | 0.0 /100 | #334 | Tragic $45,338 |
| Cheyenne | 0.0 /100 | #335 | Tragic $45,275 |
| Tohono O'odham | 0.0 /100 | #336 | Tragic $45,248 |
| Pueblo | 0.0 /100 | #337 | Tragic $45,018 |
| Chickasaw | 0.0 /100 | #338 | Tragic $44,763 |
| Kiowa | 0.0 /100 | #339 | Tragic $44,733 |
| Blacks/African Americans | 0.0 /100 | #340 | Tragic $44,381 |
Demographics Similar to Celtics by Householder Income Under 25 years
In terms of householder income under 25 years, the demographic groups most similar to Celtics are Immigrants from Mexico ($50,422, a difference of 0.050%), Immigrants from Haiti ($50,398, a difference of 0.10%), Luxembourger ($50,379, a difference of 0.13%), Immigrants from Cabo Verde ($50,520, a difference of 0.14%), and Aleut ($50,377, a difference of 0.14%).
| Demographics | Rating | Rank | Householder Income Under 25 years |
| Marshallese | 2.1 /100 | #244 | Tragic $50,627 |
| Immigrants | Africa | 2.0 /100 | #245 | Tragic $50,609 |
| Welsh | 2.0 /100 | #246 | Tragic $50,597 |
| Immigrants | Bosnia and Herzegovina | 1.8 /100 | #247 | Tragic $50,565 |
| Slavs | 1.8 /100 | #248 | Tragic $50,563 |
| Scottish | 1.8 /100 | #249 | Tragic $50,554 |
| Immigrants | Cabo Verde | 1.7 /100 | #250 | Tragic $50,520 |
| Celtics | 1.4 /100 | #251 | Tragic $50,447 |
| Immigrants | Mexico | 1.3 /100 | #252 | Tragic $50,422 |
| Immigrants | Haiti | 1.2 /100 | #253 | Tragic $50,398 |
| Luxembourgers | 1.2 /100 | #254 | Tragic $50,379 |
| Aleuts | 1.2 /100 | #255 | Tragic $50,377 |
| Immigrants | Cuba | 1.2 /100 | #256 | Tragic $50,374 |
| Lebanese | 1.1 /100 | #257 | Tragic $50,355 |
| Whites/Caucasians | 1.1 /100 | #258 | Tragic $50,336 |