Yuman vs Immigrants from Taiwan Householder Income Under 25 years
COMPARE
Yuman
Immigrants from Taiwan
Householder Income Under 25 years
Householder Income Under 25 years Comparison
Yuman
Immigrants from Taiwan
$50,933
HOUSEHOLDER INCOME UNDER 25 YEARS
4.4/ 100
METRIC RATING
229th/ 347
METRIC RANK
$59,424
HOUSEHOLDER INCOME UNDER 25 YEARS
100.0/ 100
METRIC RATING
4th/ 347
METRIC RANK
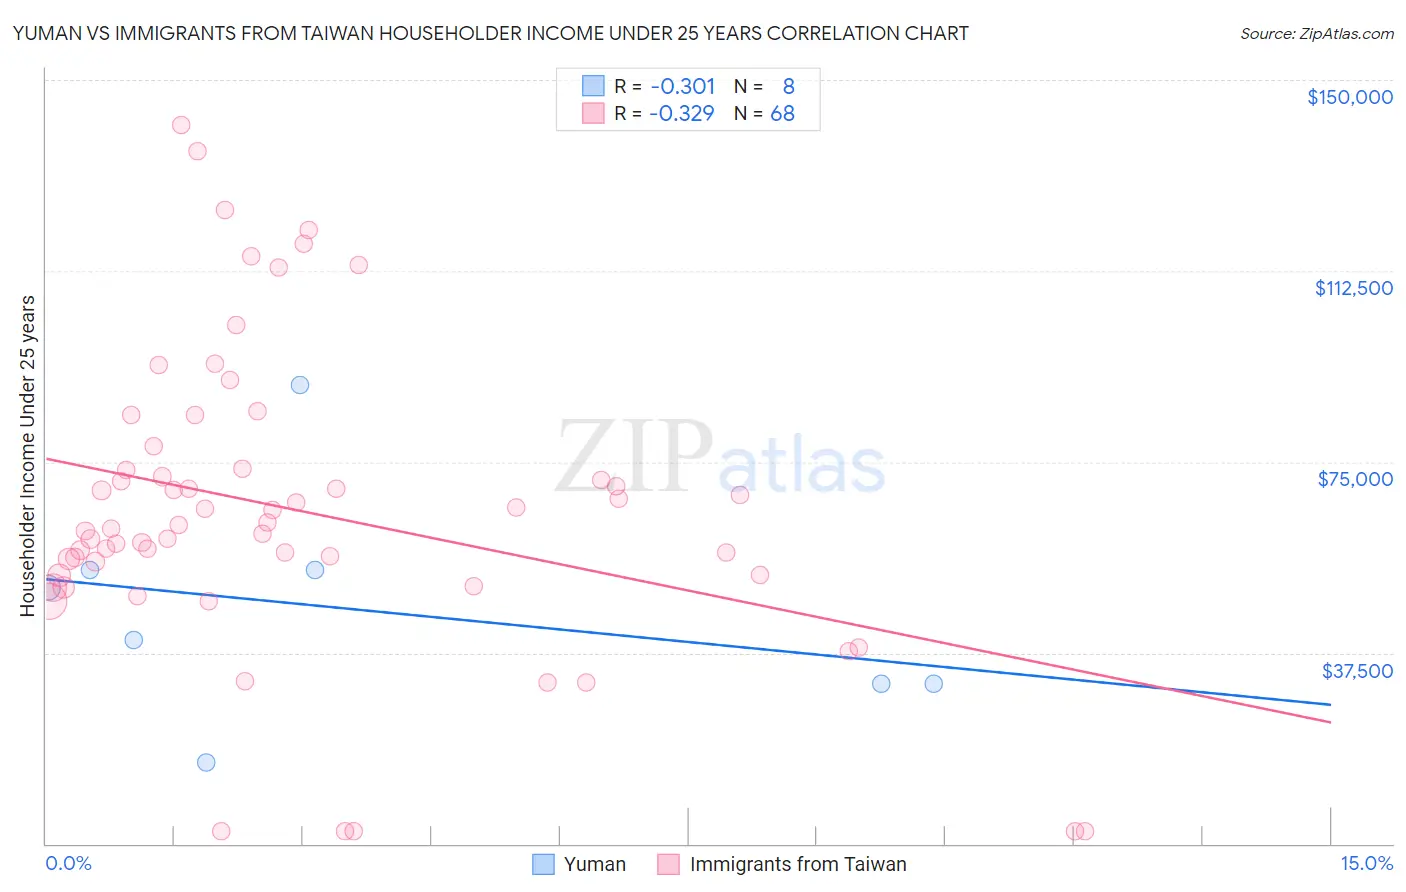
Yuman vs Immigrants from Taiwan Householder Income Under 25 years Correlation Chart
The statistical analysis conducted on geographies consisting of 39,381,315 people shows a mild negative correlation between the proportion of Yuman and household income with householder under the age of 25 in the United States with a correlation coefficient (R) of -0.301 and weighted average of $50,933. Similarly, the statistical analysis conducted on geographies consisting of 256,317,565 people shows a mild negative correlation between the proportion of Immigrants from Taiwan and household income with householder under the age of 25 in the United States with a correlation coefficient (R) of -0.329 and weighted average of $59,424, a difference of 16.7%.
Householder Income Under 25 years Correlation Summary
| Measurement | Yuman | Immigrants from Taiwan |
| Minimum | $15,893 | $2,499 |
| Maximum | $90,217 | $141,202 |
| Range | $74,324 | $138,703 |
| Mean | $45,866 | $65,450 |
| Median | $45,161 | $62,277 |
| Interquartile 25% (IQ1) | $31,448 | $52,778 |
| Interquartile 75% (IQ3) | $53,802 | $73,483 |
| Interquartile Range (IQR) | $22,354 | $20,705 |
| Standard Deviation (Sample) | $22,232 | $29,878 |
| Standard Deviation (Population) | $20,796 | $29,657 |
Similar Demographics by Householder Income Under 25 years
Demographics Similar to Yuman by Householder Income Under 25 years
In terms of householder income under 25 years, the demographic groups most similar to Yuman are Jamaican ($50,929, a difference of 0.010%), Ugandan ($50,923, a difference of 0.020%), Slovene ($50,886, a difference of 0.090%), Immigrants from Norway ($50,984, a difference of 0.10%), and Pennsylvania German ($50,852, a difference of 0.16%).
| Demographics | Rating | Rank | Householder Income Under 25 years |
| Spaniards | 6.8 /100 | #222 | Tragic $51,117 |
| Serbians | 6.6 /100 | #223 | Tragic $51,106 |
| Belizeans | 6.4 /100 | #224 | Tragic $51,094 |
| Immigrants | Jamaica | 5.6 /100 | #225 | Tragic $51,038 |
| Yugoslavians | 5.5 /100 | #226 | Tragic $51,028 |
| Immigrants | Central America | 5.4 /100 | #227 | Tragic $51,022 |
| Immigrants | Norway | 5.0 /100 | #228 | Tragic $50,984 |
| Yuman | 4.4 /100 | #229 | Tragic $50,933 |
| Jamaicans | 4.4 /100 | #230 | Tragic $50,929 |
| Ugandans | 4.3 /100 | #231 | Tragic $50,923 |
| Slovenes | 4.0 /100 | #232 | Tragic $50,886 |
| Pennsylvania Germans | 3.7 /100 | #233 | Tragic $50,852 |
| Kenyans | 3.3 /100 | #234 | Tragic $50,815 |
| Spanish | 3.3 /100 | #235 | Tragic $50,813 |
| English | 3.3 /100 | #236 | Tragic $50,805 |
Demographics Similar to Immigrants from Taiwan by Householder Income Under 25 years
In terms of householder income under 25 years, the demographic groups most similar to Immigrants from Taiwan are Immigrants from Bolivia ($59,389, a difference of 0.060%), Thai ($59,187, a difference of 0.40%), Immigrants from India ($59,914, a difference of 0.82%), Bolivian ($58,506, a difference of 1.6%), and Indian (Asian) ($58,239, a difference of 2.0%).
| Demographics | Rating | Rank | Householder Income Under 25 years |
| Assyrians/Chaldeans/Syriacs | 100.0 /100 | #1 | Exceptional $65,329 |
| Immigrants | Hong Kong | 100.0 /100 | #2 | Exceptional $62,083 |
| Immigrants | India | 100.0 /100 | #3 | Exceptional $59,914 |
| Immigrants | Taiwan | 100.0 /100 | #4 | Exceptional $59,424 |
| Immigrants | Bolivia | 100.0 /100 | #5 | Exceptional $59,389 |
| Thais | 100.0 /100 | #6 | Exceptional $59,187 |
| Bolivians | 100.0 /100 | #7 | Exceptional $58,506 |
| Indians (Asian) | 100.0 /100 | #8 | Exceptional $58,239 |
| Chinese | 100.0 /100 | #9 | Exceptional $58,162 |
| Afghans | 100.0 /100 | #10 | Exceptional $58,019 |
| Immigrants | China | 100.0 /100 | #11 | Exceptional $57,931 |
| Immigrants | Philippines | 100.0 /100 | #12 | Exceptional $57,930 |
| Immigrants | South Central Asia | 100.0 /100 | #13 | Exceptional $57,818 |
| Filipinos | 100.0 /100 | #14 | Exceptional $57,740 |
| Koreans | 100.0 /100 | #15 | Exceptional $57,730 |