Yuman vs Ugandan Householder Income Under 25 years
COMPARE
Yuman
Ugandan
Householder Income Under 25 years
Householder Income Under 25 years Comparison
Yuman
Ugandans
$50,933
HOUSEHOLDER INCOME UNDER 25 YEARS
4.4/ 100
METRIC RATING
229th/ 347
METRIC RANK
$50,923
HOUSEHOLDER INCOME UNDER 25 YEARS
4.3/ 100
METRIC RATING
231st/ 347
METRIC RANK
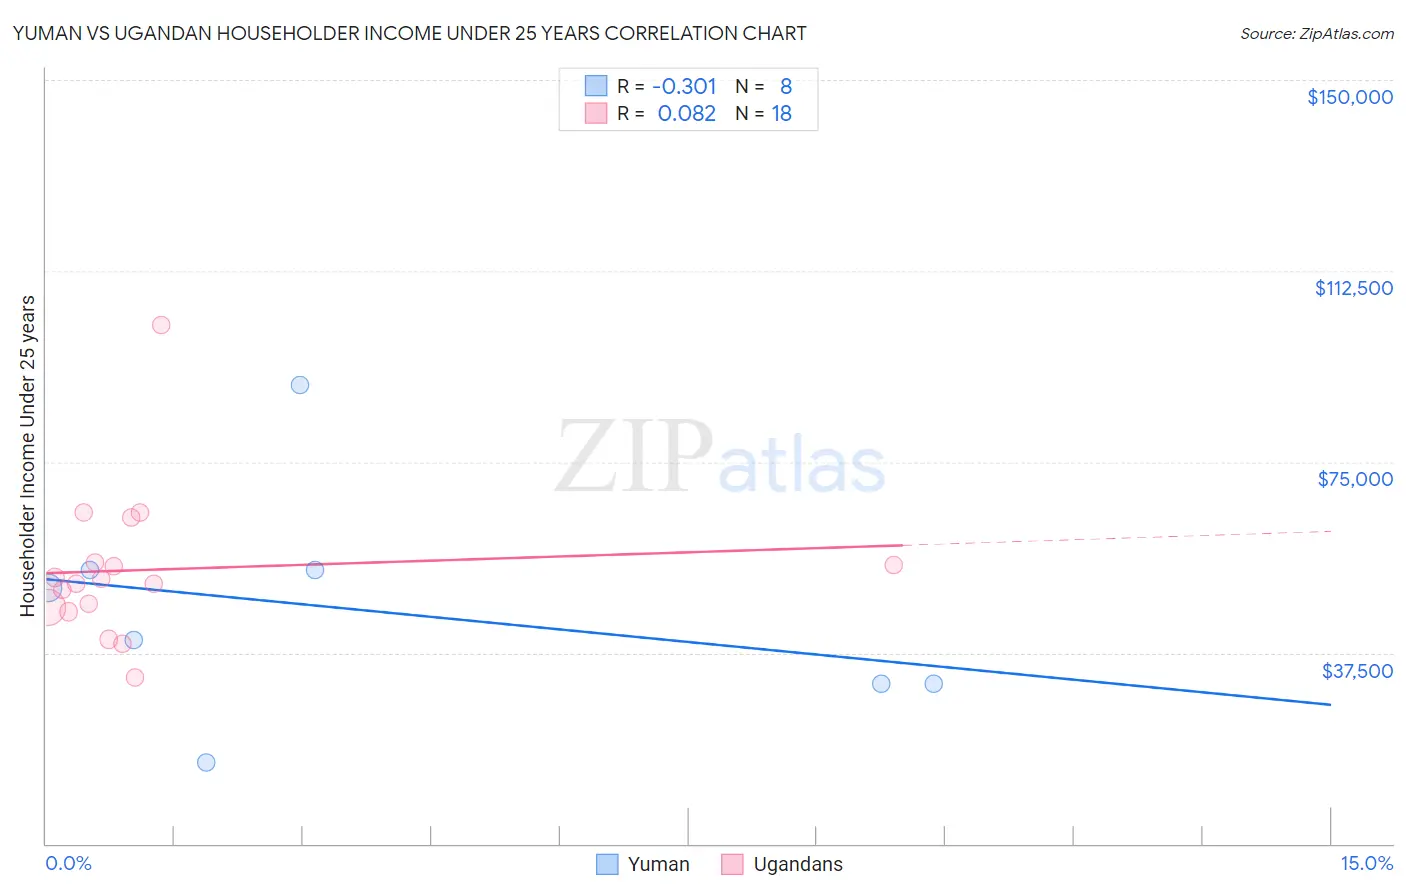
Yuman vs Ugandan Householder Income Under 25 years Correlation Chart
The statistical analysis conducted on geographies consisting of 39,381,315 people shows a mild negative correlation between the proportion of Yuman and household income with householder under the age of 25 in the United States with a correlation coefficient (R) of -0.301 and weighted average of $50,933. Similarly, the statistical analysis conducted on geographies consisting of 89,521,491 people shows a slight positive correlation between the proportion of Ugandans and household income with householder under the age of 25 in the United States with a correlation coefficient (R) of 0.082 and weighted average of $50,923, a difference of 0.020%.
Householder Income Under 25 years Correlation Summary
| Measurement | Yuman | Ugandan |
| Minimum | $15,893 | $32,682 |
| Maximum | $90,217 | $101,868 |
| Range | $74,324 | $69,186 |
| Mean | $45,866 | $53,778 |
| Median | $45,161 | $51,561 |
| Interquartile 25% (IQ1) | $31,448 | $46,457 |
| Interquartile 75% (IQ3) | $53,802 | $55,330 |
| Interquartile Range (IQR) | $22,354 | $8,874 |
| Standard Deviation (Sample) | $22,232 | $14,802 |
| Standard Deviation (Population) | $20,796 | $14,385 |
Demographics Similar to Yuman and Ugandans by Householder Income Under 25 years
In terms of householder income under 25 years, the demographic groups most similar to Yuman are Jamaican ($50,929, a difference of 0.010%), Slovene ($50,886, a difference of 0.090%), Immigrants from Norway ($50,984, a difference of 0.10%), Pennsylvania German ($50,852, a difference of 0.16%), and Immigrants from Central America ($51,022, a difference of 0.17%). Similarly, the demographic groups most similar to Ugandans are Jamaican ($50,929, a difference of 0.010%), Slovene ($50,886, a difference of 0.070%), Immigrants from Norway ($50,984, a difference of 0.12%), Pennsylvania German ($50,852, a difference of 0.14%), and Immigrants from Central America ($51,022, a difference of 0.19%).
| Demographics | Rating | Rank | Householder Income Under 25 years |
| Immigrants | Germany | 8.0 /100 | #220 | Tragic $51,190 |
| Immigrants | Eastern Africa | 7.4 /100 | #221 | Tragic $51,158 |
| Spaniards | 6.8 /100 | #222 | Tragic $51,117 |
| Serbians | 6.6 /100 | #223 | Tragic $51,106 |
| Belizeans | 6.4 /100 | #224 | Tragic $51,094 |
| Immigrants | Jamaica | 5.6 /100 | #225 | Tragic $51,038 |
| Yugoslavians | 5.5 /100 | #226 | Tragic $51,028 |
| Immigrants | Central America | 5.4 /100 | #227 | Tragic $51,022 |
| Immigrants | Norway | 5.0 /100 | #228 | Tragic $50,984 |
| Yuman | 4.4 /100 | #229 | Tragic $50,933 |
| Jamaicans | 4.4 /100 | #230 | Tragic $50,929 |
| Ugandans | 4.3 /100 | #231 | Tragic $50,923 |
| Slovenes | 4.0 /100 | #232 | Tragic $50,886 |
| Pennsylvania Germans | 3.7 /100 | #233 | Tragic $50,852 |
| Kenyans | 3.3 /100 | #234 | Tragic $50,815 |
| Spanish | 3.3 /100 | #235 | Tragic $50,813 |
| English | 3.3 /100 | #236 | Tragic $50,805 |
| Germans | 3.3 /100 | #237 | Tragic $50,804 |
| Iraqis | 3.2 /100 | #238 | Tragic $50,802 |
| Immigrants | Caribbean | 2.9 /100 | #239 | Tragic $50,757 |
| Immigrants | Lebanon | 2.7 /100 | #240 | Tragic $50,729 |