Yuman vs European Householder Income Under 25 years
COMPARE
Yuman
European
Householder Income Under 25 years
Householder Income Under 25 years Comparison
Yuman
Europeans
$50,933
HOUSEHOLDER INCOME UNDER 25 YEARS
4.4/ 100
METRIC RATING
229th/ 347
METRIC RANK
$51,796
HOUSEHOLDER INCOME UNDER 25 YEARS
27.6/ 100
METRIC RATING
181st/ 347
METRIC RANK
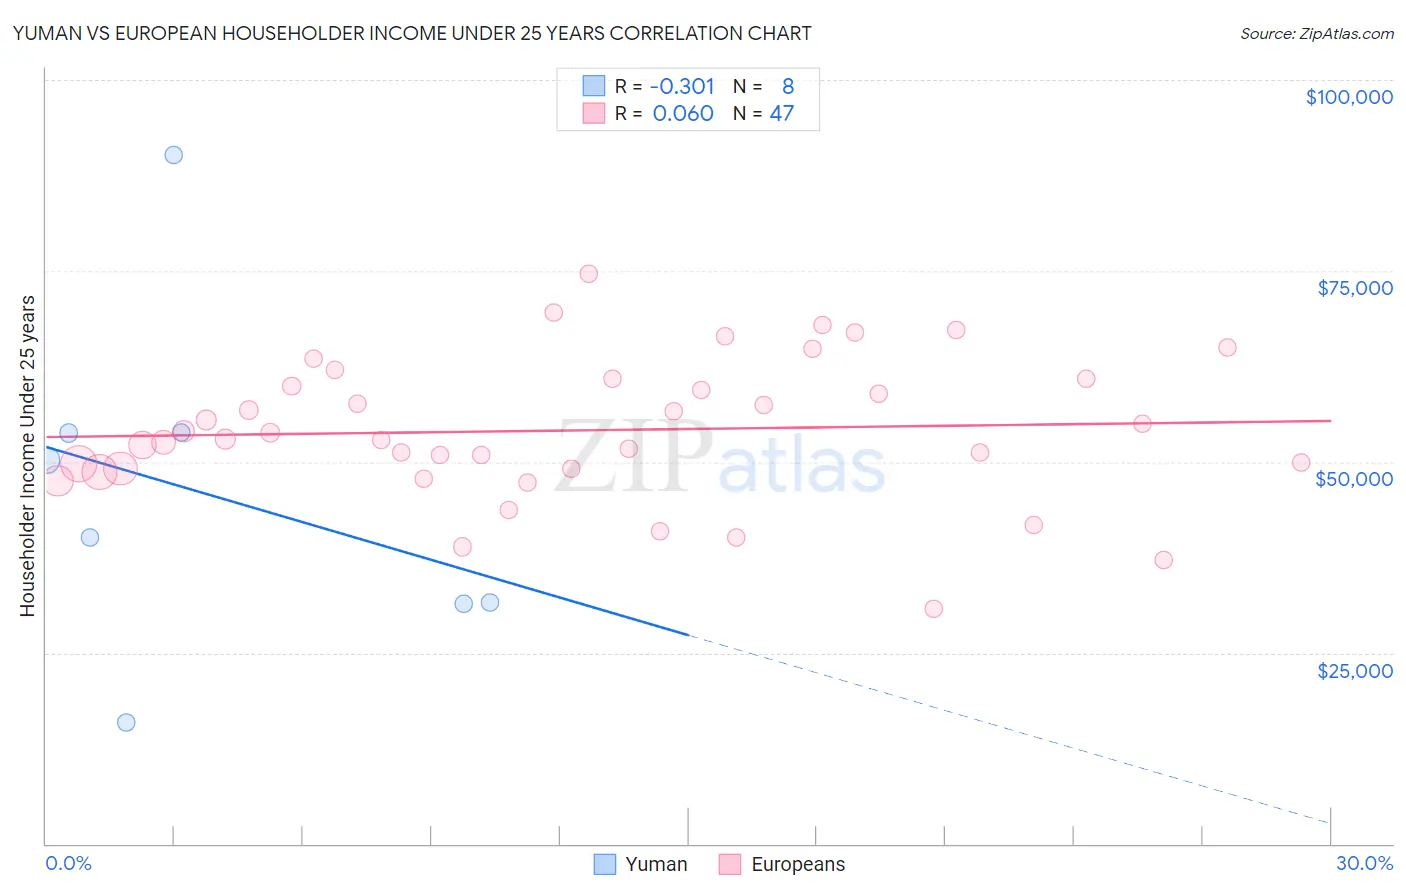
Yuman vs European Householder Income Under 25 years Correlation Chart
The statistical analysis conducted on geographies consisting of 39,381,315 people shows a mild negative correlation between the proportion of Yuman and household income with householder under the age of 25 in the United States with a correlation coefficient (R) of -0.301 and weighted average of $50,933. Similarly, the statistical analysis conducted on geographies consisting of 435,978,003 people shows a slight positive correlation between the proportion of Europeans and household income with householder under the age of 25 in the United States with a correlation coefficient (R) of 0.060 and weighted average of $51,796, a difference of 1.7%.
Householder Income Under 25 years Correlation Summary
| Measurement | Yuman | European |
| Minimum | $15,893 | $30,833 |
| Maximum | $90,217 | $74,701 |
| Range | $74,324 | $43,868 |
| Mean | $45,866 | $54,127 |
| Median | $45,161 | $52,957 |
| Interquartile 25% (IQ1) | $31,448 | $49,051 |
| Interquartile 75% (IQ3) | $53,802 | $60,889 |
| Interquartile Range (IQR) | $22,354 | $11,838 |
| Standard Deviation (Sample) | $22,232 | $9,259 |
| Standard Deviation (Population) | $20,796 | $9,160 |
Similar Demographics by Householder Income Under 25 years
Demographics Similar to Yuman by Householder Income Under 25 years
In terms of householder income under 25 years, the demographic groups most similar to Yuman are Jamaican ($50,929, a difference of 0.010%), Ugandan ($50,923, a difference of 0.020%), Slovene ($50,886, a difference of 0.090%), Immigrants from Norway ($50,984, a difference of 0.10%), and Pennsylvania German ($50,852, a difference of 0.16%).
| Demographics | Rating | Rank | Householder Income Under 25 years |
| Spaniards | 6.8 /100 | #222 | Tragic $51,117 |
| Serbians | 6.6 /100 | #223 | Tragic $51,106 |
| Belizeans | 6.4 /100 | #224 | Tragic $51,094 |
| Immigrants | Jamaica | 5.6 /100 | #225 | Tragic $51,038 |
| Yugoslavians | 5.5 /100 | #226 | Tragic $51,028 |
| Immigrants | Central America | 5.4 /100 | #227 | Tragic $51,022 |
| Immigrants | Norway | 5.0 /100 | #228 | Tragic $50,984 |
| Yuman | 4.4 /100 | #229 | Tragic $50,933 |
| Jamaicans | 4.4 /100 | #230 | Tragic $50,929 |
| Ugandans | 4.3 /100 | #231 | Tragic $50,923 |
| Slovenes | 4.0 /100 | #232 | Tragic $50,886 |
| Pennsylvania Germans | 3.7 /100 | #233 | Tragic $50,852 |
| Kenyans | 3.3 /100 | #234 | Tragic $50,815 |
| Spanish | 3.3 /100 | #235 | Tragic $50,813 |
| English | 3.3 /100 | #236 | Tragic $50,805 |
Demographics Similar to Europeans by Householder Income Under 25 years
In terms of householder income under 25 years, the demographic groups most similar to Europeans are Jordanian ($51,796, a difference of 0.0%), Mexican American Indian ($51,783, a difference of 0.030%), Basque ($51,818, a difference of 0.040%), Immigrants from England ($51,817, a difference of 0.040%), and Finnish ($51,827, a difference of 0.060%).
| Demographics | Rating | Rank | Householder Income Under 25 years |
| Immigrants | Western Asia | 50.0 /100 | #174 | Average $52,190 |
| Immigrants | Zimbabwe | 33.8 /100 | #175 | Fair $51,914 |
| Austrians | 32.9 /100 | #176 | Fair $51,898 |
| British West Indians | 30.0 /100 | #177 | Fair $51,844 |
| Finns | 29.2 /100 | #178 | Fair $51,827 |
| Basques | 28.7 /100 | #179 | Fair $51,818 |
| Immigrants | England | 28.7 /100 | #180 | Fair $51,817 |
| Europeans | 27.6 /100 | #181 | Fair $51,796 |
| Jordanians | 27.6 /100 | #182 | Fair $51,796 |
| Mexican American Indians | 27.0 /100 | #183 | Fair $51,783 |
| Paiute | 25.1 /100 | #184 | Fair $51,743 |
| Immigrants | Latvia | 24.8 /100 | #185 | Fair $51,737 |
| Alaskan Athabascans | 23.8 /100 | #186 | Fair $51,713 |
| Immigrants | South Africa | 23.4 /100 | #187 | Fair $51,705 |
| Northern Europeans | 22.2 /100 | #188 | Fair $51,678 |