Immigrants from South Central Asia vs Celtic Householder Income Under 25 years
COMPARE
Immigrants from South Central Asia
Celtic
Householder Income Under 25 years
Householder Income Under 25 years Comparison
Immigrants from South Central Asia
Celtics
$57,818
HOUSEHOLDER INCOME UNDER 25 YEARS
100.0/ 100
METRIC RATING
13th/ 347
METRIC RANK
$50,447
HOUSEHOLDER INCOME UNDER 25 YEARS
1.4/ 100
METRIC RATING
251st/ 347
METRIC RANK
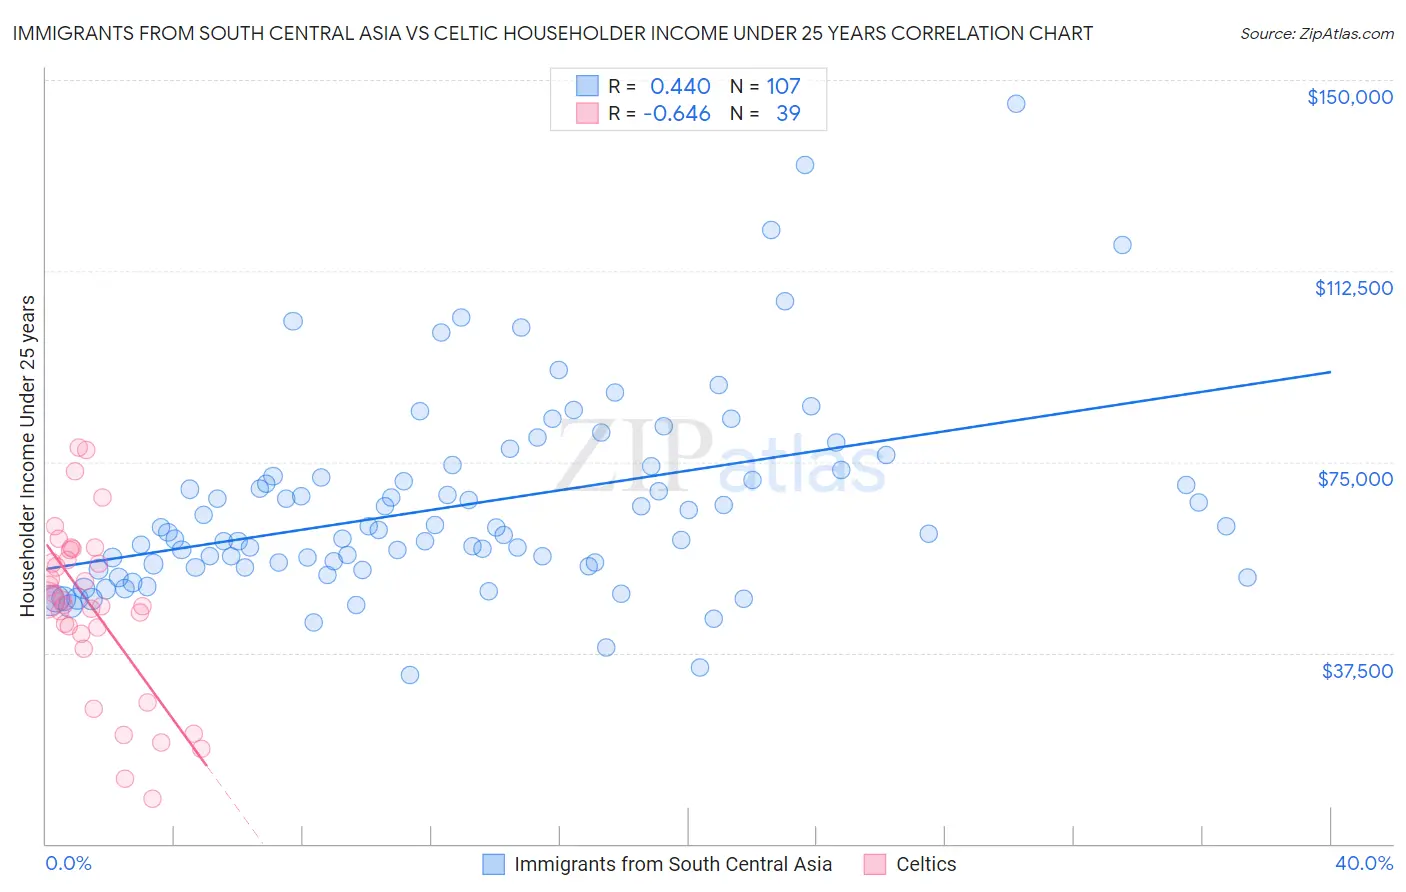
Immigrants from South Central Asia vs Celtic Householder Income Under 25 years Correlation Chart
The statistical analysis conducted on geographies consisting of 388,054,450 people shows a moderate positive correlation between the proportion of Immigrants from South Central Asia and household income with householder under the age of 25 in the United States with a correlation coefficient (R) of 0.440 and weighted average of $57,818. Similarly, the statistical analysis conducted on geographies consisting of 153,501,532 people shows a significant negative correlation between the proportion of Celtics and household income with householder under the age of 25 in the United States with a correlation coefficient (R) of -0.646 and weighted average of $50,447, a difference of 14.6%.
Householder Income Under 25 years Correlation Summary
| Measurement | Immigrants from South Central Asia | Celtic |
| Minimum | $33,081 | $8,850 |
| Maximum | $145,332 | $77,857 |
| Range | $112,251 | $69,007 |
| Mean | $66,338 | $46,502 |
| Median | $61,115 | $47,888 |
| Interquartile 25% (IQ1) | $54,287 | $41,319 |
| Interquartile 75% (IQ3) | $72,177 | $57,577 |
| Interquartile Range (IQR) | $17,889 | $16,258 |
| Standard Deviation (Sample) | $19,355 | $16,722 |
| Standard Deviation (Population) | $19,264 | $16,506 |
Similar Demographics by Householder Income Under 25 years
Demographics Similar to Immigrants from South Central Asia by Householder Income Under 25 years
In terms of householder income under 25 years, the demographic groups most similar to Immigrants from South Central Asia are Filipino ($57,740, a difference of 0.14%), Korean ($57,730, a difference of 0.15%), Immigrants from Philippines ($57,930, a difference of 0.19%), Immigrants from China ($57,931, a difference of 0.20%), and Afghan ($58,019, a difference of 0.35%).
| Demographics | Rating | Rank | Householder Income Under 25 years |
| Thais | 100.0 /100 | #6 | Exceptional $59,187 |
| Bolivians | 100.0 /100 | #7 | Exceptional $58,506 |
| Indians (Asian) | 100.0 /100 | #8 | Exceptional $58,239 |
| Chinese | 100.0 /100 | #9 | Exceptional $58,162 |
| Afghans | 100.0 /100 | #10 | Exceptional $58,019 |
| Immigrants | China | 100.0 /100 | #11 | Exceptional $57,931 |
| Immigrants | Philippines | 100.0 /100 | #12 | Exceptional $57,930 |
| Immigrants | South Central Asia | 100.0 /100 | #13 | Exceptional $57,818 |
| Filipinos | 100.0 /100 | #14 | Exceptional $57,740 |
| Koreans | 100.0 /100 | #15 | Exceptional $57,730 |
| Immigrants | Afghanistan | 100.0 /100 | #16 | Exceptional $57,478 |
| Sierra Leoneans | 100.0 /100 | #17 | Exceptional $57,272 |
| Immigrants | Eastern Asia | 100.0 /100 | #18 | Exceptional $57,123 |
| Bhutanese | 100.0 /100 | #19 | Exceptional $57,078 |
| Immigrants | Ireland | 100.0 /100 | #20 | Exceptional $57,075 |
Demographics Similar to Celtics by Householder Income Under 25 years
In terms of householder income under 25 years, the demographic groups most similar to Celtics are Immigrants from Mexico ($50,422, a difference of 0.050%), Immigrants from Haiti ($50,398, a difference of 0.10%), Luxembourger ($50,379, a difference of 0.13%), Immigrants from Cabo Verde ($50,520, a difference of 0.14%), and Aleut ($50,377, a difference of 0.14%).
| Demographics | Rating | Rank | Householder Income Under 25 years |
| Marshallese | 2.1 /100 | #244 | Tragic $50,627 |
| Immigrants | Africa | 2.0 /100 | #245 | Tragic $50,609 |
| Welsh | 2.0 /100 | #246 | Tragic $50,597 |
| Immigrants | Bosnia and Herzegovina | 1.8 /100 | #247 | Tragic $50,565 |
| Slavs | 1.8 /100 | #248 | Tragic $50,563 |
| Scottish | 1.8 /100 | #249 | Tragic $50,554 |
| Immigrants | Cabo Verde | 1.7 /100 | #250 | Tragic $50,520 |
| Celtics | 1.4 /100 | #251 | Tragic $50,447 |
| Immigrants | Mexico | 1.3 /100 | #252 | Tragic $50,422 |
| Immigrants | Haiti | 1.2 /100 | #253 | Tragic $50,398 |
| Luxembourgers | 1.2 /100 | #254 | Tragic $50,379 |
| Aleuts | 1.2 /100 | #255 | Tragic $50,377 |
| Immigrants | Cuba | 1.2 /100 | #256 | Tragic $50,374 |
| Lebanese | 1.1 /100 | #257 | Tragic $50,355 |
| Whites/Caucasians | 1.1 /100 | #258 | Tragic $50,336 |