Yugoslavian vs Ottawa Median Male Earnings
COMPARE
Yugoslavian
Ottawa
Median Male Earnings
Median Male Earnings Comparison
Yugoslavians
Ottawa
$53,967
MEDIAN MALE EARNINGS
37.4/ 100
METRIC RATING
182nd/ 347
METRIC RANK
$46,611
MEDIAN MALE EARNINGS
0.0/ 100
METRIC RATING
308th/ 347
METRIC RANK
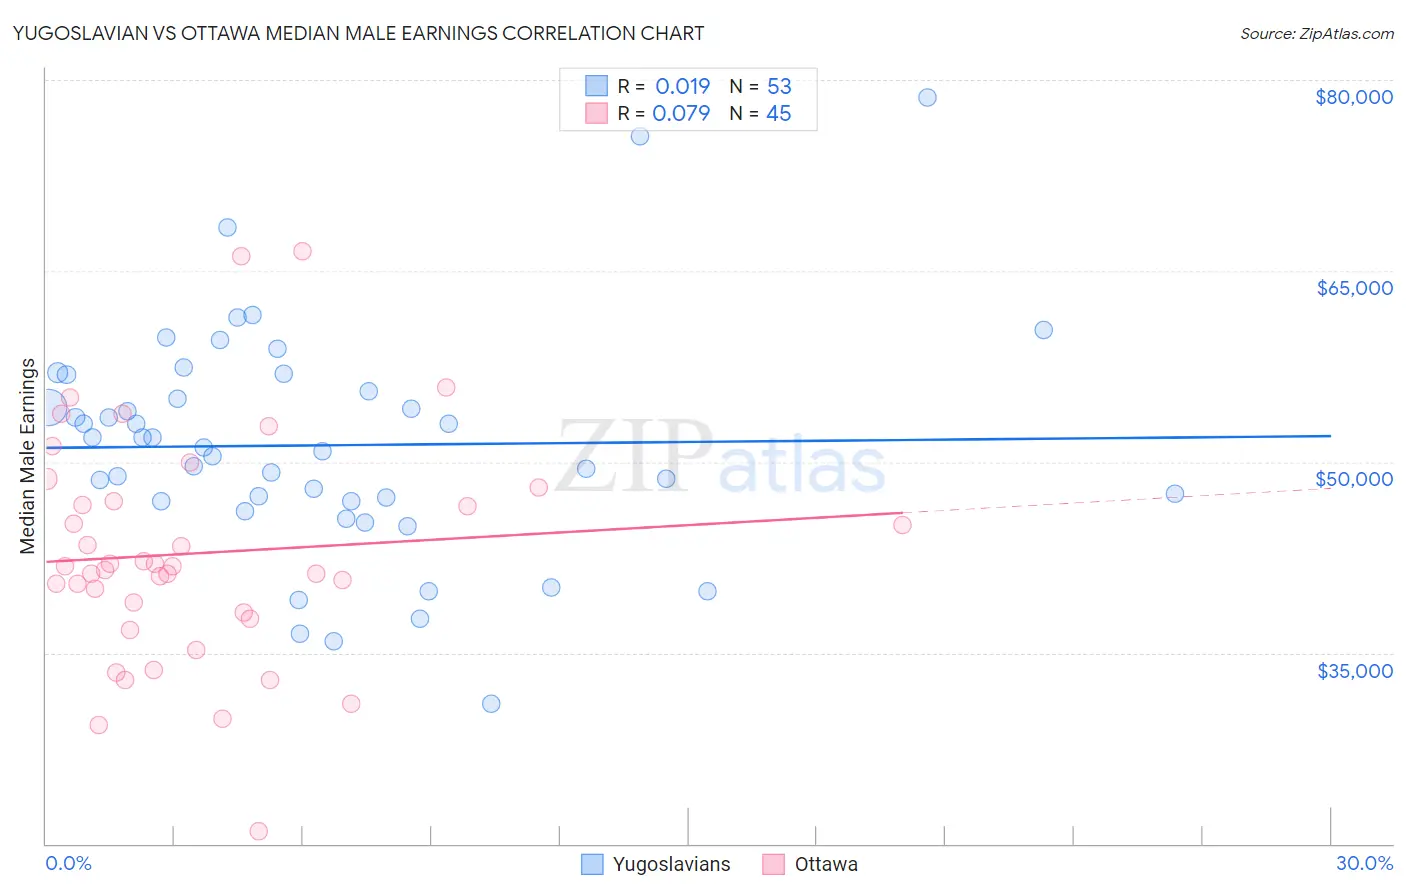
Yugoslavian vs Ottawa Median Male Earnings Correlation Chart
The statistical analysis conducted on geographies consisting of 285,670,858 people shows no correlation between the proportion of Yugoslavians and median male earnings in the United States with a correlation coefficient (R) of 0.019 and weighted average of $53,967. Similarly, the statistical analysis conducted on geographies consisting of 49,954,818 people shows a slight positive correlation between the proportion of Ottawa and median male earnings in the United States with a correlation coefficient (R) of 0.079 and weighted average of $46,611, a difference of 15.8%.
Median Male Earnings Correlation Summary
| Measurement | Yugoslavian | Ottawa |
| Minimum | $30,961 | $20,938 |
| Maximum | $78,594 | $66,563 |
| Range | $47,633 | $45,625 |
| Mean | $51,302 | $42,823 |
| Median | $51,102 | $41,768 |
| Interquartile 25% (IQ1) | $46,894 | $37,908 |
| Interquartile 75% (IQ3) | $56,167 | $47,441 |
| Interquartile Range (IQR) | $9,274 | $9,533 |
| Standard Deviation (Sample) | $8,961 | $8,970 |
| Standard Deviation (Population) | $8,876 | $8,870 |
Similar Demographics by Median Male Earnings
Demographics Similar to Yugoslavians by Median Male Earnings
In terms of median male earnings, the demographic groups most similar to Yugoslavians are Immigrants from South America ($53,962, a difference of 0.010%), White/Caucasian ($53,925, a difference of 0.080%), Immigrants from Sierra Leone ($53,905, a difference of 0.11%), Colombian ($53,832, a difference of 0.25%), and Immigrants ($54,168, a difference of 0.37%).
| Demographics | Rating | Rank | Median Male Earnings |
| Dutch | 48.0 /100 | #175 | Average $54,410 |
| Spaniards | 47.8 /100 | #176 | Average $54,401 |
| Costa Ricans | 44.8 /100 | #177 | Average $54,279 |
| Sierra Leoneans | 44.8 /100 | #178 | Average $54,279 |
| Celtics | 43.9 /100 | #179 | Average $54,242 |
| Iraqis | 42.5 /100 | #180 | Average $54,182 |
| Immigrants | Immigrants | 42.1 /100 | #181 | Average $54,168 |
| Yugoslavians | 37.4 /100 | #182 | Fair $53,967 |
| Immigrants | South America | 37.3 /100 | #183 | Fair $53,962 |
| Whites/Caucasians | 36.5 /100 | #184 | Fair $53,925 |
| Immigrants | Sierra Leone | 36.0 /100 | #185 | Fair $53,905 |
| Colombians | 34.4 /100 | #186 | Fair $53,832 |
| Immigrants | Eritrea | 31.8 /100 | #187 | Fair $53,715 |
| Immigrants | Eastern Africa | 31.8 /100 | #188 | Fair $53,713 |
| Puget Sound Salish | 31.6 /100 | #189 | Fair $53,704 |
Demographics Similar to Ottawa by Median Male Earnings
In terms of median male earnings, the demographic groups most similar to Ottawa are Creek ($46,594, a difference of 0.040%), Cuban ($46,580, a difference of 0.070%), Immigrants from Dominican Republic ($46,655, a difference of 0.090%), Dutch West Indian ($46,656, a difference of 0.10%), and Guatemalan ($46,736, a difference of 0.27%).
| Demographics | Rating | Rank | Median Male Earnings |
| Immigrants | Latin America | 0.1 /100 | #301 | Tragic $46,941 |
| Seminole | 0.1 /100 | #302 | Tragic $46,783 |
| Yaqui | 0.1 /100 | #303 | Tragic $46,777 |
| Bangladeshis | 0.1 /100 | #304 | Tragic $46,744 |
| Guatemalans | 0.0 /100 | #305 | Tragic $46,736 |
| Dutch West Indians | 0.0 /100 | #306 | Tragic $46,656 |
| Immigrants | Dominican Republic | 0.0 /100 | #307 | Tragic $46,655 |
| Ottawa | 0.0 /100 | #308 | Tragic $46,611 |
| Creek | 0.0 /100 | #309 | Tragic $46,594 |
| Cubans | 0.0 /100 | #310 | Tragic $46,580 |
| Apache | 0.0 /100 | #311 | Tragic $46,429 |
| Hispanics or Latinos | 0.0 /100 | #312 | Tragic $46,419 |
| Hondurans | 0.0 /100 | #313 | Tragic $46,374 |
| Chippewa | 0.0 /100 | #314 | Tragic $46,368 |
| Immigrants | Guatemala | 0.0 /100 | #315 | Tragic $46,244 |