Yugoslavian vs Ottawa Professional Degree
COMPARE
Yugoslavian
Ottawa
Professional Degree
Professional Degree Comparison
Yugoslavians
Ottawa
4.1%
PROFESSIONAL DEGREE
13.4/ 100
METRIC RATING
206th/ 347
METRIC RANK
3.4%
PROFESSIONAL DEGREE
0.2/ 100
METRIC RATING
298th/ 347
METRIC RANK
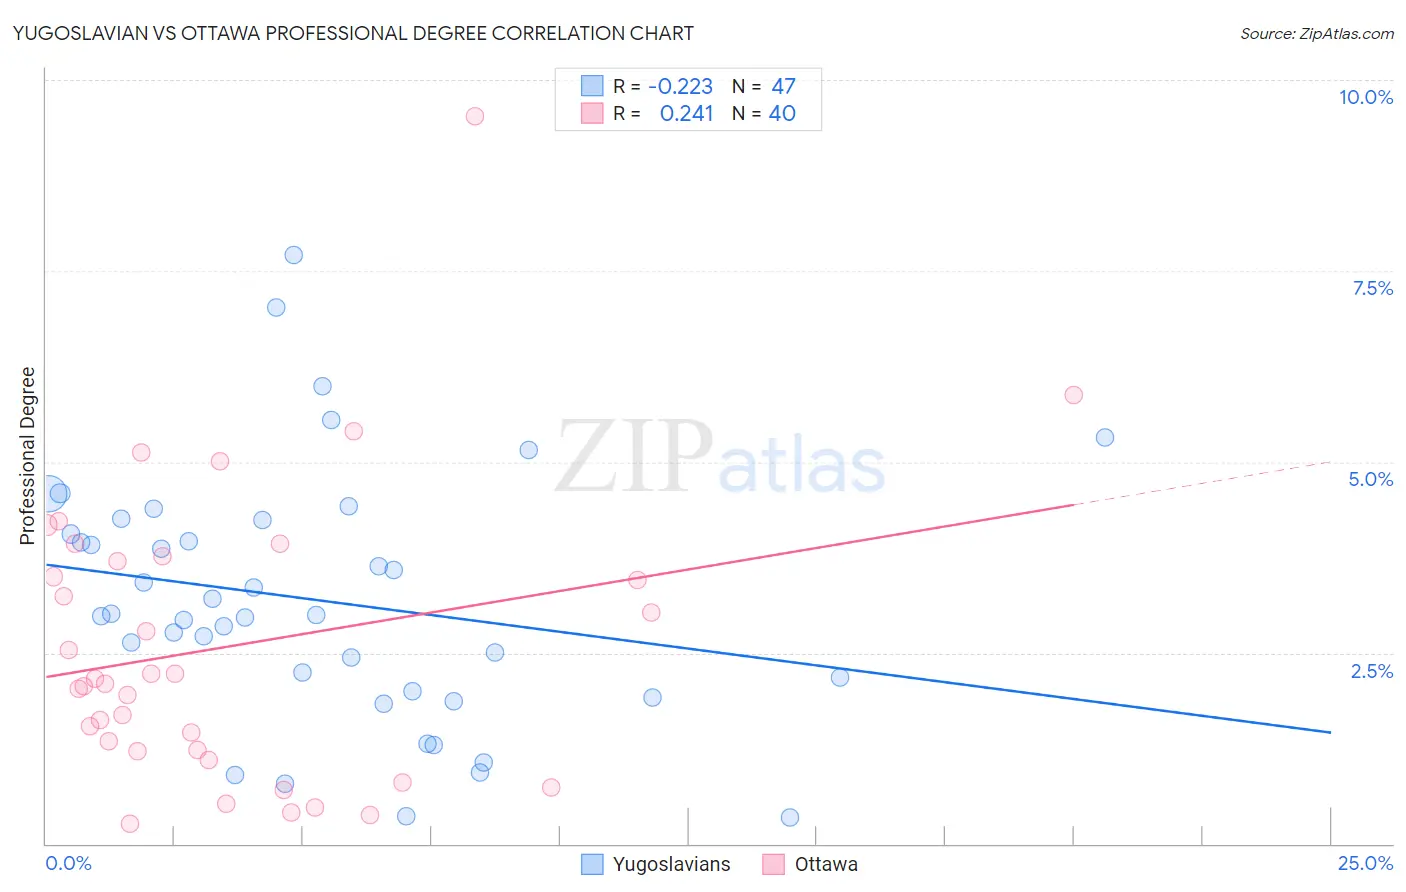
Yugoslavian vs Ottawa Professional Degree Correlation Chart
The statistical analysis conducted on geographies consisting of 285,276,070 people shows a weak negative correlation between the proportion of Yugoslavians and percentage of population with at least professional degree education in the United States with a correlation coefficient (R) of -0.223 and weighted average of 4.1%. Similarly, the statistical analysis conducted on geographies consisting of 49,856,239 people shows a weak positive correlation between the proportion of Ottawa and percentage of population with at least professional degree education in the United States with a correlation coefficient (R) of 0.241 and weighted average of 3.4%, a difference of 19.8%.
Professional Degree Correlation Summary
| Measurement | Yugoslavian | Ottawa |
| Minimum | 0.35% | 0.25% |
| Maximum | 7.7% | 9.5% |
| Range | 7.4% | 9.3% |
| Mean | 3.2% | 2.6% |
| Median | 3.0% | 2.1% |
| Interquartile 25% (IQ1) | 2.0% | 1.2% |
| Interquartile 75% (IQ3) | 4.2% | 3.7% |
| Interquartile Range (IQR) | 2.2% | 2.5% |
| Standard Deviation (Sample) | 1.6% | 1.9% |
| Standard Deviation (Population) | 1.6% | 1.9% |
Similar Demographics by Professional Degree
Demographics Similar to Yugoslavians by Professional Degree
In terms of professional degree, the demographic groups most similar to Yugoslavians are Subsaharan African (4.1%, a difference of 0.24%), Immigrants from Somalia (4.1%, a difference of 0.32%), Immigrants from Panama (4.1%, a difference of 0.40%), Somali (4.1%, a difference of 0.42%), and Immigrants from Nigeria (4.1%, a difference of 0.62%).
| Demographics | Rating | Rank | Professional Degree |
| Norwegians | 20.5 /100 | #199 | Fair 4.2% |
| Immigrants | North Macedonia | 20.2 /100 | #200 | Fair 4.2% |
| Finns | 18.7 /100 | #201 | Poor 4.2% |
| Immigrants | Iraq | 17.1 /100 | #202 | Poor 4.2% |
| Panamanians | 15.9 /100 | #203 | Poor 4.1% |
| Barbadians | 15.8 /100 | #204 | Poor 4.1% |
| Somalis | 14.8 /100 | #205 | Poor 4.1% |
| Yugoslavians | 13.4 /100 | #206 | Poor 4.1% |
| Sub-Saharan Africans | 12.8 /100 | #207 | Poor 4.1% |
| Immigrants | Somalia | 12.5 /100 | #208 | Poor 4.1% |
| Immigrants | Panama | 12.3 /100 | #209 | Poor 4.1% |
| Immigrants | Nigeria | 11.7 /100 | #210 | Poor 4.1% |
| Germans | 11.6 /100 | #211 | Poor 4.1% |
| Whites/Caucasians | 11.2 /100 | #212 | Poor 4.1% |
| Koreans | 10.7 /100 | #213 | Poor 4.1% |
Demographics Similar to Ottawa by Professional Degree
In terms of professional degree, the demographic groups most similar to Ottawa are Immigrants from Liberia (3.4%, a difference of 0.050%), Hawaiian (3.4%, a difference of 0.39%), Immigrants from Guatemala (3.4%, a difference of 0.40%), Paiute (3.4%, a difference of 0.56%), and Immigrants from Honduras (3.5%, a difference of 0.64%).
| Demographics | Rating | Rank | Professional Degree |
| Alaska Natives | 0.3 /100 | #291 | Tragic 3.5% |
| Immigrants | Belize | 0.3 /100 | #292 | Tragic 3.5% |
| Immigrants | Honduras | 0.3 /100 | #293 | Tragic 3.5% |
| Paiute | 0.3 /100 | #294 | Tragic 3.4% |
| Immigrants | Guatemala | 0.2 /100 | #295 | Tragic 3.4% |
| Hawaiians | 0.2 /100 | #296 | Tragic 3.4% |
| Immigrants | Liberia | 0.2 /100 | #297 | Tragic 3.4% |
| Ottawa | 0.2 /100 | #298 | Tragic 3.4% |
| Immigrants | Yemen | 0.2 /100 | #299 | Tragic 3.4% |
| Blacks/African Americans | 0.2 /100 | #300 | Tragic 3.4% |
| Immigrants | Dominican Republic | 0.2 /100 | #301 | Tragic 3.4% |
| Malaysians | 0.2 /100 | #302 | Tragic 3.4% |
| Immigrants | Haiti | 0.2 /100 | #303 | Tragic 3.4% |
| Cajuns | 0.2 /100 | #304 | Tragic 3.4% |
| Chickasaw | 0.1 /100 | #305 | Tragic 3.4% |