Polish vs Ottawa Median Male Earnings
COMPARE
Polish
Ottawa
Median Male Earnings
Median Male Earnings Comparison
Poles
Ottawa
$58,139
MEDIAN MALE EARNINGS
97.3/ 100
METRIC RATING
103rd/ 347
METRIC RANK
$46,611
MEDIAN MALE EARNINGS
0.0/ 100
METRIC RATING
308th/ 347
METRIC RANK
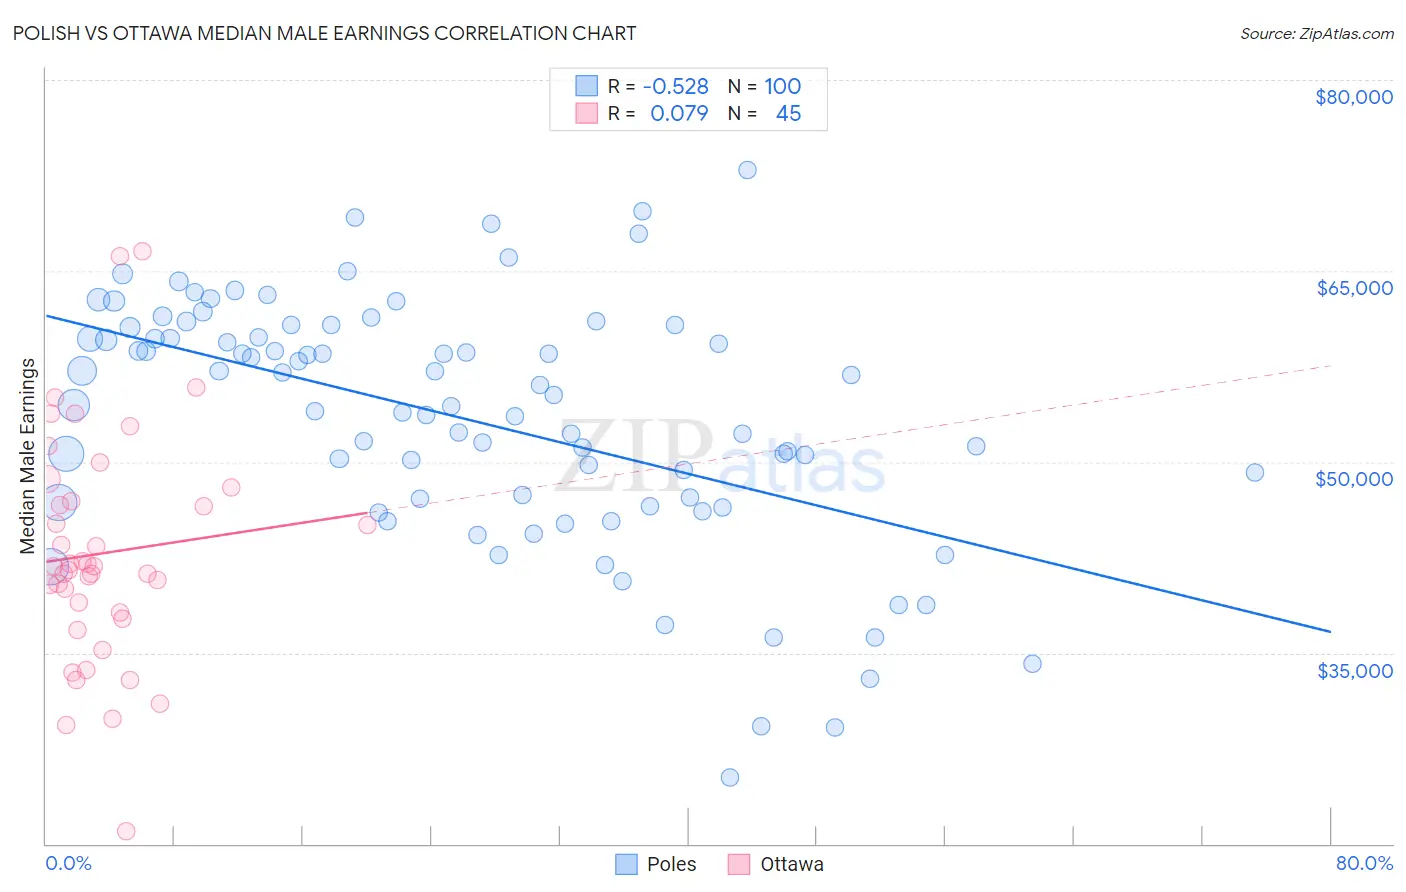
Polish vs Ottawa Median Male Earnings Correlation Chart
The statistical analysis conducted on geographies consisting of 559,585,611 people shows a substantial negative correlation between the proportion of Poles and median male earnings in the United States with a correlation coefficient (R) of -0.528 and weighted average of $58,139. Similarly, the statistical analysis conducted on geographies consisting of 49,954,818 people shows a slight positive correlation between the proportion of Ottawa and median male earnings in the United States with a correlation coefficient (R) of 0.079 and weighted average of $46,611, a difference of 24.7%.
Median Male Earnings Correlation Summary
| Measurement | Polish | Ottawa |
| Minimum | $25,204 | $20,938 |
| Maximum | $72,933 | $66,563 |
| Range | $47,729 | $45,625 |
| Mean | $53,382 | $42,823 |
| Median | $54,879 | $41,768 |
| Interquartile 25% (IQ1) | $46,953 | $37,908 |
| Interquartile 75% (IQ3) | $60,187 | $47,441 |
| Interquartile Range (IQR) | $13,234 | $9,533 |
| Standard Deviation (Sample) | $9,652 | $8,970 |
| Standard Deviation (Population) | $9,604 | $8,870 |
Similar Demographics by Median Male Earnings
Demographics Similar to Poles by Median Male Earnings
In terms of median male earnings, the demographic groups most similar to Poles are Armenian ($58,134, a difference of 0.010%), Immigrants from Western Asia ($58,131, a difference of 0.020%), Syrian ($58,187, a difference of 0.080%), Immigrants from Northern Africa ($58,008, a difference of 0.23%), and Serbian ($57,975, a difference of 0.28%).
| Demographics | Rating | Rank | Median Male Earnings |
| Albanians | 98.4 /100 | #96 | Exceptional $58,680 |
| Northern Europeans | 98.2 /100 | #97 | Exceptional $58,588 |
| Jordanians | 98.1 /100 | #98 | Exceptional $58,500 |
| Immigrants | Poland | 98.0 /100 | #99 | Exceptional $58,452 |
| Assyrians/Chaldeans/Syriacs | 97.9 /100 | #100 | Exceptional $58,437 |
| Immigrants | Brazil | 97.7 /100 | #101 | Exceptional $58,324 |
| Syrians | 97.4 /100 | #102 | Exceptional $58,187 |
| Poles | 97.3 /100 | #103 | Exceptional $58,139 |
| Armenians | 97.3 /100 | #104 | Exceptional $58,134 |
| Immigrants | Western Asia | 97.3 /100 | #105 | Exceptional $58,131 |
| Immigrants | Northern Africa | 96.9 /100 | #106 | Exceptional $58,008 |
| Serbians | 96.8 /100 | #107 | Exceptional $57,975 |
| Immigrants | Uzbekistan | 96.7 /100 | #108 | Exceptional $57,941 |
| British | 96.5 /100 | #109 | Exceptional $57,890 |
| Palestinians | 96.2 /100 | #110 | Exceptional $57,778 |
Demographics Similar to Ottawa by Median Male Earnings
In terms of median male earnings, the demographic groups most similar to Ottawa are Creek ($46,594, a difference of 0.040%), Cuban ($46,580, a difference of 0.070%), Immigrants from Dominican Republic ($46,655, a difference of 0.090%), Dutch West Indian ($46,656, a difference of 0.10%), and Guatemalan ($46,736, a difference of 0.27%).
| Demographics | Rating | Rank | Median Male Earnings |
| Immigrants | Latin America | 0.1 /100 | #301 | Tragic $46,941 |
| Seminole | 0.1 /100 | #302 | Tragic $46,783 |
| Yaqui | 0.1 /100 | #303 | Tragic $46,777 |
| Bangladeshis | 0.1 /100 | #304 | Tragic $46,744 |
| Guatemalans | 0.0 /100 | #305 | Tragic $46,736 |
| Dutch West Indians | 0.0 /100 | #306 | Tragic $46,656 |
| Immigrants | Dominican Republic | 0.0 /100 | #307 | Tragic $46,655 |
| Ottawa | 0.0 /100 | #308 | Tragic $46,611 |
| Creek | 0.0 /100 | #309 | Tragic $46,594 |
| Cubans | 0.0 /100 | #310 | Tragic $46,580 |
| Apache | 0.0 /100 | #311 | Tragic $46,429 |
| Hispanics or Latinos | 0.0 /100 | #312 | Tragic $46,419 |
| Hondurans | 0.0 /100 | #313 | Tragic $46,374 |
| Chippewa | 0.0 /100 | #314 | Tragic $46,368 |
| Immigrants | Guatemala | 0.0 /100 | #315 | Tragic $46,244 |