Immigrants from Africa vs Ottawa Median Male Earnings
COMPARE
Immigrants from Africa
Ottawa
Median Male Earnings
Median Male Earnings Comparison
Immigrants from Africa
Ottawa
$53,457
MEDIAN MALE EARNINGS
26.6/ 100
METRIC RATING
196th/ 347
METRIC RANK
$46,611
MEDIAN MALE EARNINGS
0.0/ 100
METRIC RATING
308th/ 347
METRIC RANK
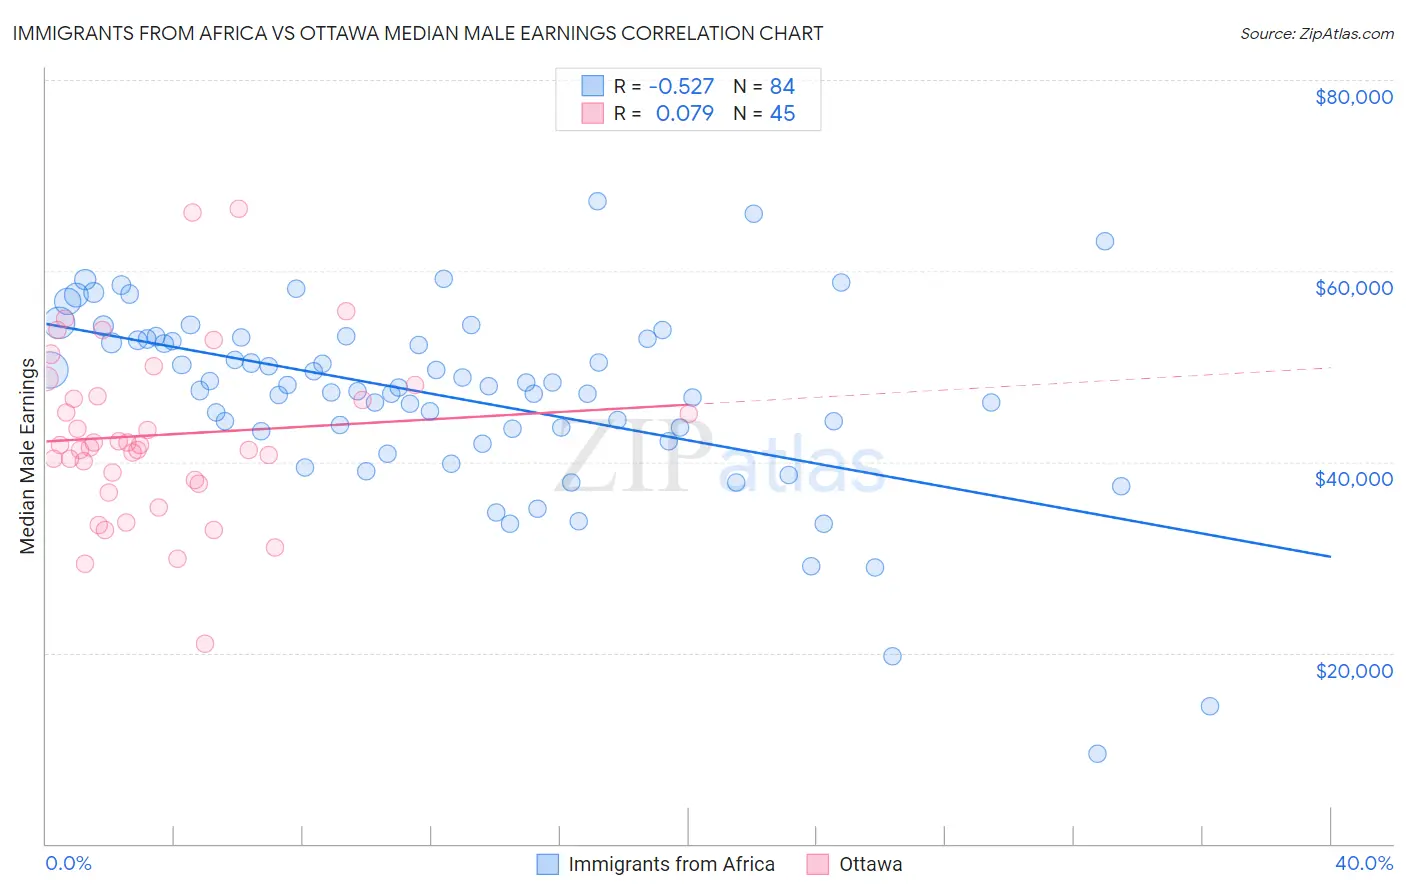
Immigrants from Africa vs Ottawa Median Male Earnings Correlation Chart
The statistical analysis conducted on geographies consisting of 469,220,260 people shows a substantial negative correlation between the proportion of Immigrants from Africa and median male earnings in the United States with a correlation coefficient (R) of -0.527 and weighted average of $53,457. Similarly, the statistical analysis conducted on geographies consisting of 49,954,818 people shows a slight positive correlation between the proportion of Ottawa and median male earnings in the United States with a correlation coefficient (R) of 0.079 and weighted average of $46,611, a difference of 14.7%.
Median Male Earnings Correlation Summary
| Measurement | Immigrants from Africa | Ottawa |
| Minimum | $9,467 | $20,938 |
| Maximum | $67,337 | $66,563 |
| Range | $57,870 | $45,625 |
| Mean | $46,791 | $42,823 |
| Median | $47,827 | $41,768 |
| Interquartile 25% (IQ1) | $43,316 | $37,908 |
| Interquartile 75% (IQ3) | $52,867 | $47,441 |
| Interquartile Range (IQR) | $9,551 | $9,533 |
| Standard Deviation (Sample) | $9,958 | $8,970 |
| Standard Deviation (Population) | $9,899 | $8,870 |
Similar Demographics by Median Male Earnings
Demographics Similar to Immigrants from Africa by Median Male Earnings
In terms of median male earnings, the demographic groups most similar to Immigrants from Africa are Immigrants from Kenya ($53,427, a difference of 0.060%), Immigrants from the Azores ($53,503, a difference of 0.090%), Spanish ($53,576, a difference of 0.22%), Kenyan ($53,647, a difference of 0.36%), and Guamanian/Chamorro ($53,661, a difference of 0.38%).
| Demographics | Rating | Rank | Median Male Earnings |
| Puget Sound Salish | 31.6 /100 | #189 | Fair $53,704 |
| Uruguayans | 31.1 /100 | #190 | Fair $53,680 |
| Guamanians/Chamorros | 30.7 /100 | #191 | Fair $53,661 |
| Scotch-Irish | 30.6 /100 | #192 | Fair $53,658 |
| Kenyans | 30.4 /100 | #193 | Fair $53,647 |
| Spanish | 29.0 /100 | #194 | Fair $53,576 |
| Immigrants | Azores | 27.5 /100 | #195 | Fair $53,503 |
| Immigrants | Africa | 26.6 /100 | #196 | Fair $53,457 |
| Immigrants | Kenya | 26.0 /100 | #197 | Fair $53,427 |
| Immigrants | Costa Rica | 22.6 /100 | #198 | Fair $53,237 |
| Tongans | 22.3 /100 | #199 | Fair $53,218 |
| Immigrants | Thailand | 17.5 /100 | #200 | Poor $52,908 |
| Immigrants | Bosnia and Herzegovina | 16.9 /100 | #201 | Poor $52,869 |
| Immigrants | Uruguay | 16.8 /100 | #202 | Poor $52,860 |
| Panamanians | 16.5 /100 | #203 | Poor $52,835 |
Demographics Similar to Ottawa by Median Male Earnings
In terms of median male earnings, the demographic groups most similar to Ottawa are Creek ($46,594, a difference of 0.040%), Cuban ($46,580, a difference of 0.070%), Immigrants from Dominican Republic ($46,655, a difference of 0.090%), Dutch West Indian ($46,656, a difference of 0.10%), and Guatemalan ($46,736, a difference of 0.27%).
| Demographics | Rating | Rank | Median Male Earnings |
| Immigrants | Latin America | 0.1 /100 | #301 | Tragic $46,941 |
| Seminole | 0.1 /100 | #302 | Tragic $46,783 |
| Yaqui | 0.1 /100 | #303 | Tragic $46,777 |
| Bangladeshis | 0.1 /100 | #304 | Tragic $46,744 |
| Guatemalans | 0.0 /100 | #305 | Tragic $46,736 |
| Dutch West Indians | 0.0 /100 | #306 | Tragic $46,656 |
| Immigrants | Dominican Republic | 0.0 /100 | #307 | Tragic $46,655 |
| Ottawa | 0.0 /100 | #308 | Tragic $46,611 |
| Creek | 0.0 /100 | #309 | Tragic $46,594 |
| Cubans | 0.0 /100 | #310 | Tragic $46,580 |
| Apache | 0.0 /100 | #311 | Tragic $46,429 |
| Hispanics or Latinos | 0.0 /100 | #312 | Tragic $46,419 |
| Hondurans | 0.0 /100 | #313 | Tragic $46,374 |
| Chippewa | 0.0 /100 | #314 | Tragic $46,368 |
| Immigrants | Guatemala | 0.0 /100 | #315 | Tragic $46,244 |