Yugoslavian vs Ottawa Female Poverty Among 18-24 Year Olds
COMPARE
Yugoslavian
Ottawa
Female Poverty Among 18-24 Year Olds
Female Poverty Among 18-24 Year Olds Comparison
Yugoslavians
Ottawa
19.8%
FEMALE POVERTY AMONG 18-24 YEAR OLDS
79.0/ 100
METRIC RATING
152nd/ 347
METRIC RANK
22.0%
FEMALE POVERTY AMONG 18-24 YEAR OLDS
0.0/ 100
METRIC RATING
285th/ 347
METRIC RANK
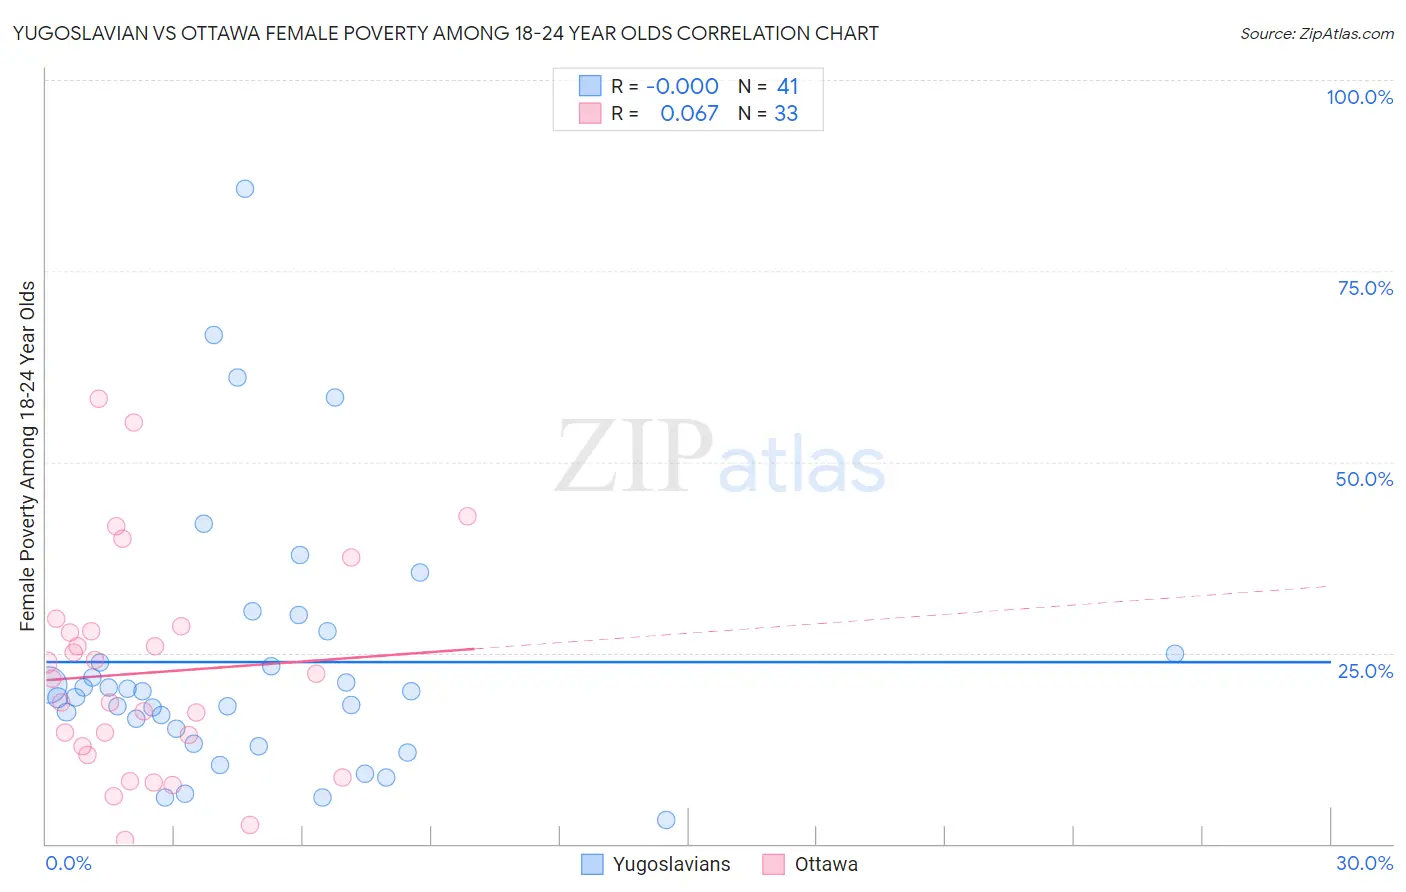
Yugoslavian vs Ottawa Female Poverty Among 18-24 Year Olds Correlation Chart
The statistical analysis conducted on geographies consisting of 280,461,515 people shows no correlation between the proportion of Yugoslavians and poverty level among females between the ages 18 and 24 in the United States with a correlation coefficient (R) of -0.000 and weighted average of 19.8%. Similarly, the statistical analysis conducted on geographies consisting of 49,589,208 people shows a slight positive correlation between the proportion of Ottawa and poverty level among females between the ages 18 and 24 in the United States with a correlation coefficient (R) of 0.067 and weighted average of 22.0%, a difference of 11.5%.
Female Poverty Among 18-24 Year Olds Correlation Summary
| Measurement | Yugoslavian | Ottawa |
| Minimum | 3.2% | 0.42% |
| Maximum | 85.7% | 58.3% |
| Range | 82.5% | 57.9% |
| Mean | 23.8% | 22.4% |
| Median | 20.0% | 21.6% |
| Interquartile 25% (IQ1) | 14.1% | 12.2% |
| Interquartile 75% (IQ3) | 26.3% | 28.1% |
| Interquartile Range (IQR) | 12.2% | 15.9% |
| Standard Deviation (Sample) | 17.2% | 14.0% |
| Standard Deviation (Population) | 17.0% | 13.8% |
Similar Demographics by Female Poverty Among 18-24 Year Olds
Demographics Similar to Yugoslavians by Female Poverty Among 18-24 Year Olds
In terms of female poverty among 18-24 year olds, the demographic groups most similar to Yugoslavians are Immigrants from Eastern Asia (19.8%, a difference of 0.050%), Immigrants from Japan (19.8%, a difference of 0.060%), Syrian (19.8%, a difference of 0.090%), Immigrants from Oceania (19.7%, a difference of 0.17%), and Immigrants from Zimbabwe (19.8%, a difference of 0.17%).
| Demographics | Rating | Rank | Female Poverty Among 18-24 Year Olds |
| Canadians | 83.8 /100 | #145 | Excellent 19.7% |
| Immigrants | Bosnia and Herzegovina | 83.6 /100 | #146 | Excellent 19.7% |
| Immigrants | Austria | 83.1 /100 | #147 | Excellent 19.7% |
| Immigrants | Latin America | 81.3 /100 | #148 | Excellent 19.7% |
| Immigrants | Oceania | 81.2 /100 | #149 | Excellent 19.7% |
| Syrians | 80.2 /100 | #150 | Excellent 19.8% |
| Immigrants | Eastern Asia | 79.7 /100 | #151 | Good 19.8% |
| Yugoslavians | 79.0 /100 | #152 | Good 19.8% |
| Immigrants | Japan | 78.1 /100 | #153 | Good 19.8% |
| Immigrants | Zimbabwe | 76.7 /100 | #154 | Good 19.8% |
| Hungarians | 76.6 /100 | #155 | Good 19.8% |
| Immigrants | Belgium | 76.4 /100 | #156 | Good 19.8% |
| Danes | 75.5 /100 | #157 | Good 19.8% |
| Immigrants | Lebanon | 75.3 /100 | #158 | Good 19.8% |
| Trinidadians and Tobagonians | 74.4 /100 | #159 | Good 19.8% |
Demographics Similar to Ottawa by Female Poverty Among 18-24 Year Olds
In terms of female poverty among 18-24 year olds, the demographic groups most similar to Ottawa are Tlingit-Haida (22.0%, a difference of 0.12%), Subsaharan African (22.0%, a difference of 0.13%), Ugandan (22.1%, a difference of 0.19%), Immigrants from Middle Africa (22.1%, a difference of 0.20%), and Bermudan (21.9%, a difference of 0.43%).
| Demographics | Rating | Rank | Female Poverty Among 18-24 Year Olds |
| Yaqui | 0.1 /100 | #278 | Tragic 21.9% |
| Spanish Americans | 0.1 /100 | #279 | Tragic 21.9% |
| Immigrants | Dominica | 0.1 /100 | #280 | Tragic 21.9% |
| Immigrants | Dominican Republic | 0.1 /100 | #281 | Tragic 21.9% |
| Bermudans | 0.1 /100 | #282 | Tragic 21.9% |
| Sub-Saharan Africans | 0.0 /100 | #283 | Tragic 22.0% |
| Tlingit-Haida | 0.0 /100 | #284 | Tragic 22.0% |
| Ottawa | 0.0 /100 | #285 | Tragic 22.0% |
| Ugandans | 0.0 /100 | #286 | Tragic 22.1% |
| Immigrants | Middle Africa | 0.0 /100 | #287 | Tragic 22.1% |
| Dominicans | 0.0 /100 | #288 | Tragic 22.3% |
| French American Indians | 0.0 /100 | #289 | Tragic 22.3% |
| Immigrants | Senegal | 0.0 /100 | #290 | Tragic 22.4% |
| Bangladeshis | 0.0 /100 | #291 | Tragic 22.5% |
| Alaskan Athabascans | 0.0 /100 | #292 | Tragic 22.5% |