Yugoslavian vs Cree Median Male Earnings
COMPARE
Yugoslavian
Cree
Median Male Earnings
Median Male Earnings Comparison
Yugoslavians
Cree
$53,967
MEDIAN MALE EARNINGS
37.4/ 100
METRIC RATING
182nd/ 347
METRIC RANK
$49,497
MEDIAN MALE EARNINGS
0.7/ 100
METRIC RATING
258th/ 347
METRIC RANK
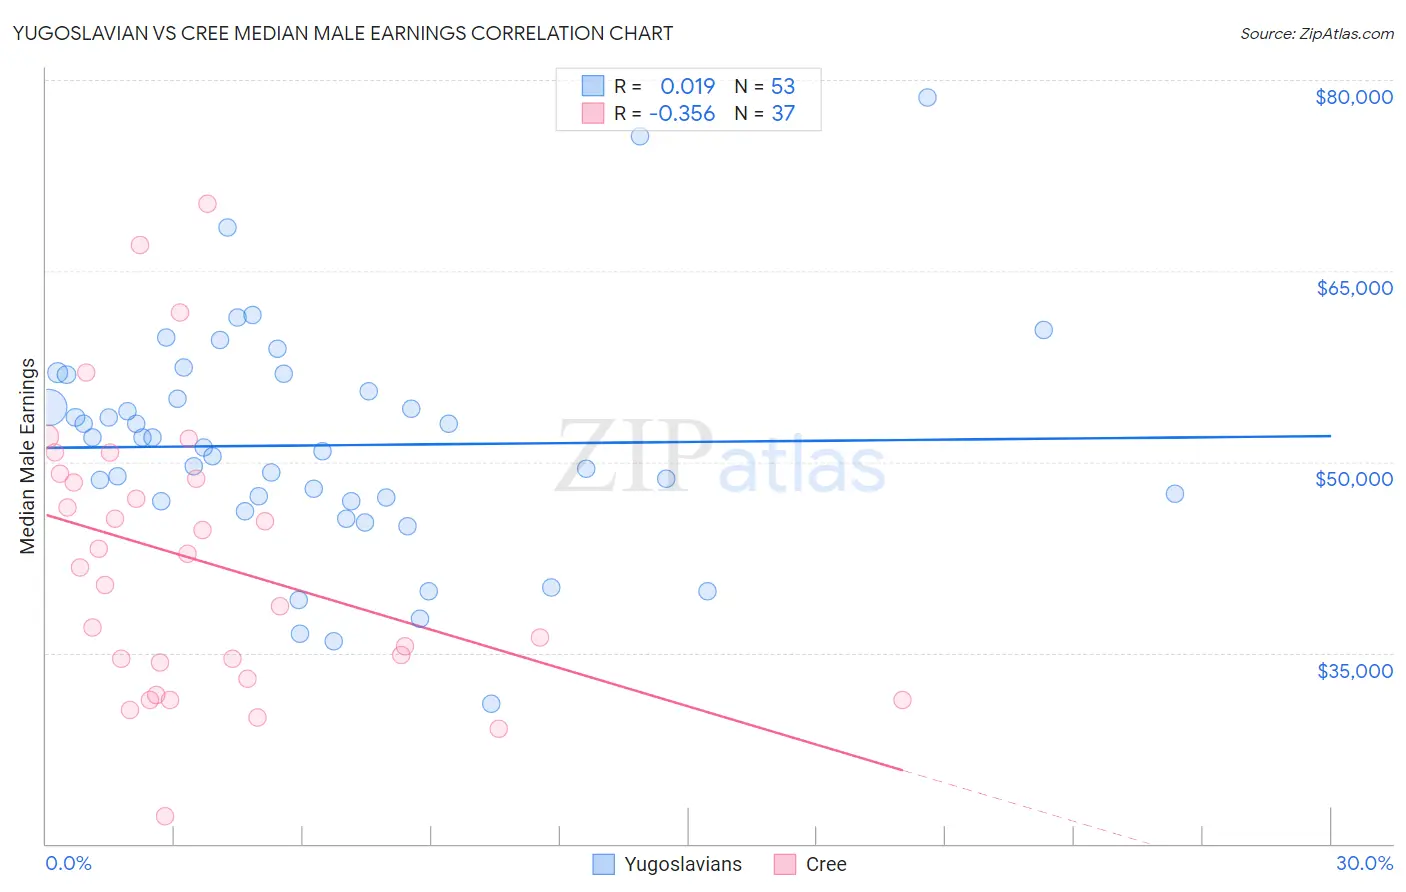
Yugoslavian vs Cree Median Male Earnings Correlation Chart
The statistical analysis conducted on geographies consisting of 285,670,858 people shows no correlation between the proportion of Yugoslavians and median male earnings in the United States with a correlation coefficient (R) of 0.019 and weighted average of $53,967. Similarly, the statistical analysis conducted on geographies consisting of 76,198,776 people shows a mild negative correlation between the proportion of Cree and median male earnings in the United States with a correlation coefficient (R) of -0.356 and weighted average of $49,497, a difference of 9.0%.
Median Male Earnings Correlation Summary
| Measurement | Yugoslavian | Cree |
| Minimum | $30,961 | $22,163 |
| Maximum | $78,594 | $70,294 |
| Range | $47,633 | $48,131 |
| Mean | $51,302 | $42,158 |
| Median | $51,102 | $41,730 |
| Interquartile 25% (IQ1) | $46,894 | $33,580 |
| Interquartile 75% (IQ3) | $56,167 | $48,892 |
| Interquartile Range (IQR) | $9,274 | $15,312 |
| Standard Deviation (Sample) | $8,961 | $10,951 |
| Standard Deviation (Population) | $8,876 | $10,802 |
Similar Demographics by Median Male Earnings
Demographics Similar to Yugoslavians by Median Male Earnings
In terms of median male earnings, the demographic groups most similar to Yugoslavians are Immigrants from South America ($53,962, a difference of 0.010%), White/Caucasian ($53,925, a difference of 0.080%), Immigrants from Sierra Leone ($53,905, a difference of 0.11%), Colombian ($53,832, a difference of 0.25%), and Immigrants ($54,168, a difference of 0.37%).
| Demographics | Rating | Rank | Median Male Earnings |
| Dutch | 48.0 /100 | #175 | Average $54,410 |
| Spaniards | 47.8 /100 | #176 | Average $54,401 |
| Costa Ricans | 44.8 /100 | #177 | Average $54,279 |
| Sierra Leoneans | 44.8 /100 | #178 | Average $54,279 |
| Celtics | 43.9 /100 | #179 | Average $54,242 |
| Iraqis | 42.5 /100 | #180 | Average $54,182 |
| Immigrants | Immigrants | 42.1 /100 | #181 | Average $54,168 |
| Yugoslavians | 37.4 /100 | #182 | Fair $53,967 |
| Immigrants | South America | 37.3 /100 | #183 | Fair $53,962 |
| Whites/Caucasians | 36.5 /100 | #184 | Fair $53,925 |
| Immigrants | Sierra Leone | 36.0 /100 | #185 | Fair $53,905 |
| Colombians | 34.4 /100 | #186 | Fair $53,832 |
| Immigrants | Eritrea | 31.8 /100 | #187 | Fair $53,715 |
| Immigrants | Eastern Africa | 31.8 /100 | #188 | Fair $53,713 |
| Puget Sound Salish | 31.6 /100 | #189 | Fair $53,704 |
Demographics Similar to Cree by Median Male Earnings
In terms of median male earnings, the demographic groups most similar to Cree are Nepalese ($49,458, a difference of 0.080%), Iroquois ($49,374, a difference of 0.25%), British West Indian ($49,636, a difference of 0.28%), Liberian ($49,318, a difference of 0.36%), and Alaska Native ($49,711, a difference of 0.43%).
| Demographics | Rating | Rank | Median Male Earnings |
| Immigrants | Grenada | 1.6 /100 | #251 | Tragic $50,279 |
| Immigrants | Cabo Verde | 1.2 /100 | #252 | Tragic $50,009 |
| German Russians | 1.1 /100 | #253 | Tragic $49,924 |
| Senegalese | 1.0 /100 | #254 | Tragic $49,774 |
| Alaskan Athabascans | 0.9 /100 | #255 | Tragic $49,748 |
| Alaska Natives | 0.9 /100 | #256 | Tragic $49,711 |
| British West Indians | 0.8 /100 | #257 | Tragic $49,636 |
| Cree | 0.7 /100 | #258 | Tragic $49,497 |
| Nepalese | 0.7 /100 | #259 | Tragic $49,458 |
| Iroquois | 0.7 /100 | #260 | Tragic $49,374 |
| Liberians | 0.6 /100 | #261 | Tragic $49,318 |
| Immigrants | West Indies | 0.6 /100 | #262 | Tragic $49,271 |
| Nicaraguans | 0.6 /100 | #263 | Tragic $49,215 |
| Immigrants | Middle Africa | 0.6 /100 | #264 | Tragic $49,201 |
| Immigrants | Laos | 0.6 /100 | #265 | Tragic $49,190 |