Immigrants from Sri Lanka vs Immigrants from Latvia Median Male Earnings
COMPARE
Immigrants from Sri Lanka
Immigrants from Latvia
Median Male Earnings
Median Male Earnings Comparison
Immigrants from Sri Lanka
Immigrants from Latvia
$63,099
MEDIAN MALE EARNINGS
100.0/ 100
METRIC RATING
37th/ 347
METRIC RANK
$61,422
MEDIAN MALE EARNINGS
99.9/ 100
METRIC RATING
54th/ 347
METRIC RANK
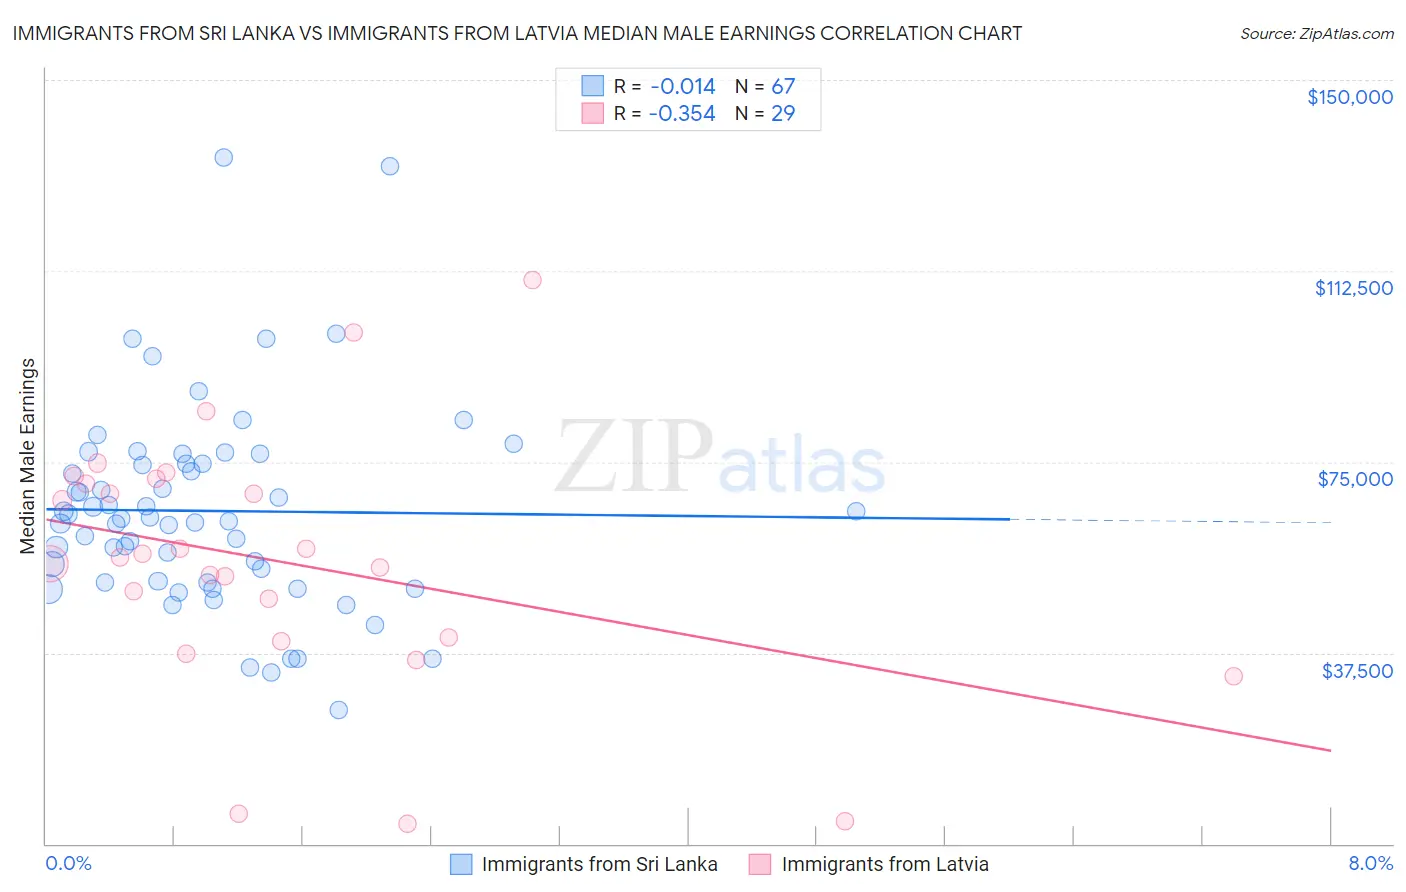
Immigrants from Sri Lanka vs Immigrants from Latvia Median Male Earnings Correlation Chart
The statistical analysis conducted on geographies consisting of 149,678,305 people shows no correlation between the proportion of Immigrants from Sri Lanka and median male earnings in the United States with a correlation coefficient (R) of -0.014 and weighted average of $63,099. Similarly, the statistical analysis conducted on geographies consisting of 113,724,849 people shows a mild negative correlation between the proportion of Immigrants from Latvia and median male earnings in the United States with a correlation coefficient (R) of -0.354 and weighted average of $61,422, a difference of 2.7%.
Median Male Earnings Correlation Summary
| Measurement | Immigrants from Sri Lanka | Immigrants from Latvia |
| Minimum | $26,357 | $3,900 |
| Maximum | $134,837 | $110,833 |
| Range | $108,480 | $106,933 |
| Mean | $65,375 | $55,354 |
| Median | $63,858 | $56,127 |
| Interquartile 25% (IQ1) | $51,338 | $40,143 |
| Interquartile 75% (IQ3) | $74,628 | $71,183 |
| Interquartile Range (IQR) | $23,290 | $31,039 |
| Standard Deviation (Sample) | $20,034 | $24,947 |
| Standard Deviation (Population) | $19,884 | $24,513 |
Demographics Similar to Immigrants from Sri Lanka and Immigrants from Latvia by Median Male Earnings
In terms of median male earnings, the demographic groups most similar to Immigrants from Sri Lanka are Israeli ($63,228, a difference of 0.20%), Immigrants from Asia ($63,240, a difference of 0.22%), Maltese ($62,953, a difference of 0.23%), Immigrants from South Africa ($62,899, a difference of 0.32%), and Australian ($62,857, a difference of 0.39%). Similarly, the demographic groups most similar to Immigrants from Latvia are South African ($61,460, a difference of 0.060%), Greek ($61,242, a difference of 0.29%), Immigrants from Norway ($61,628, a difference of 0.34%), Estonian ($61,710, a difference of 0.47%), and Bhutanese ($61,759, a difference of 0.55%).
| Demographics | Rating | Rank | Median Male Earnings |
| Immigrants | Asia | 100.0 /100 | #35 | Exceptional $63,240 |
| Israelis | 100.0 /100 | #36 | Exceptional $63,228 |
| Immigrants | Sri Lanka | 100.0 /100 | #37 | Exceptional $63,099 |
| Maltese | 100.0 /100 | #38 | Exceptional $62,953 |
| Immigrants | South Africa | 100.0 /100 | #39 | Exceptional $62,899 |
| Australians | 100.0 /100 | #40 | Exceptional $62,857 |
| Immigrants | Turkey | 100.0 /100 | #41 | Exceptional $62,728 |
| Immigrants | Greece | 100.0 /100 | #42 | Exceptional $62,689 |
| Immigrants | Belarus | 100.0 /100 | #43 | Exceptional $62,658 |
| Cambodians | 100.0 /100 | #44 | Exceptional $62,516 |
| Bulgarians | 100.0 /100 | #45 | Exceptional $62,378 |
| Immigrants | Czechoslovakia | 99.9 /100 | #46 | Exceptional $62,217 |
| Immigrants | Austria | 99.9 /100 | #47 | Exceptional $62,164 |
| Immigrants | Malaysia | 99.9 /100 | #48 | Exceptional $62,121 |
| Immigrants | Europe | 99.9 /100 | #49 | Exceptional $62,057 |
| Bhutanese | 99.9 /100 | #50 | Exceptional $61,759 |
| Estonians | 99.9 /100 | #51 | Exceptional $61,710 |
| Immigrants | Norway | 99.9 /100 | #52 | Exceptional $61,628 |
| South Africans | 99.9 /100 | #53 | Exceptional $61,460 |
| Immigrants | Latvia | 99.9 /100 | #54 | Exceptional $61,422 |
| Greeks | 99.9 /100 | #55 | Exceptional $61,242 |