Yaqui vs Immigrants from Latvia 5th Grade
COMPARE
Yaqui
Immigrants from Latvia
5th Grade
5th Grade Comparison
Yaqui
Immigrants from Latvia
96.7%
5TH GRADE
0.1/ 100
METRIC RATING
273rd/ 347
METRIC RANK
97.7%
5TH GRADE
97.1/ 100
METRIC RATING
109th/ 347
METRIC RANK
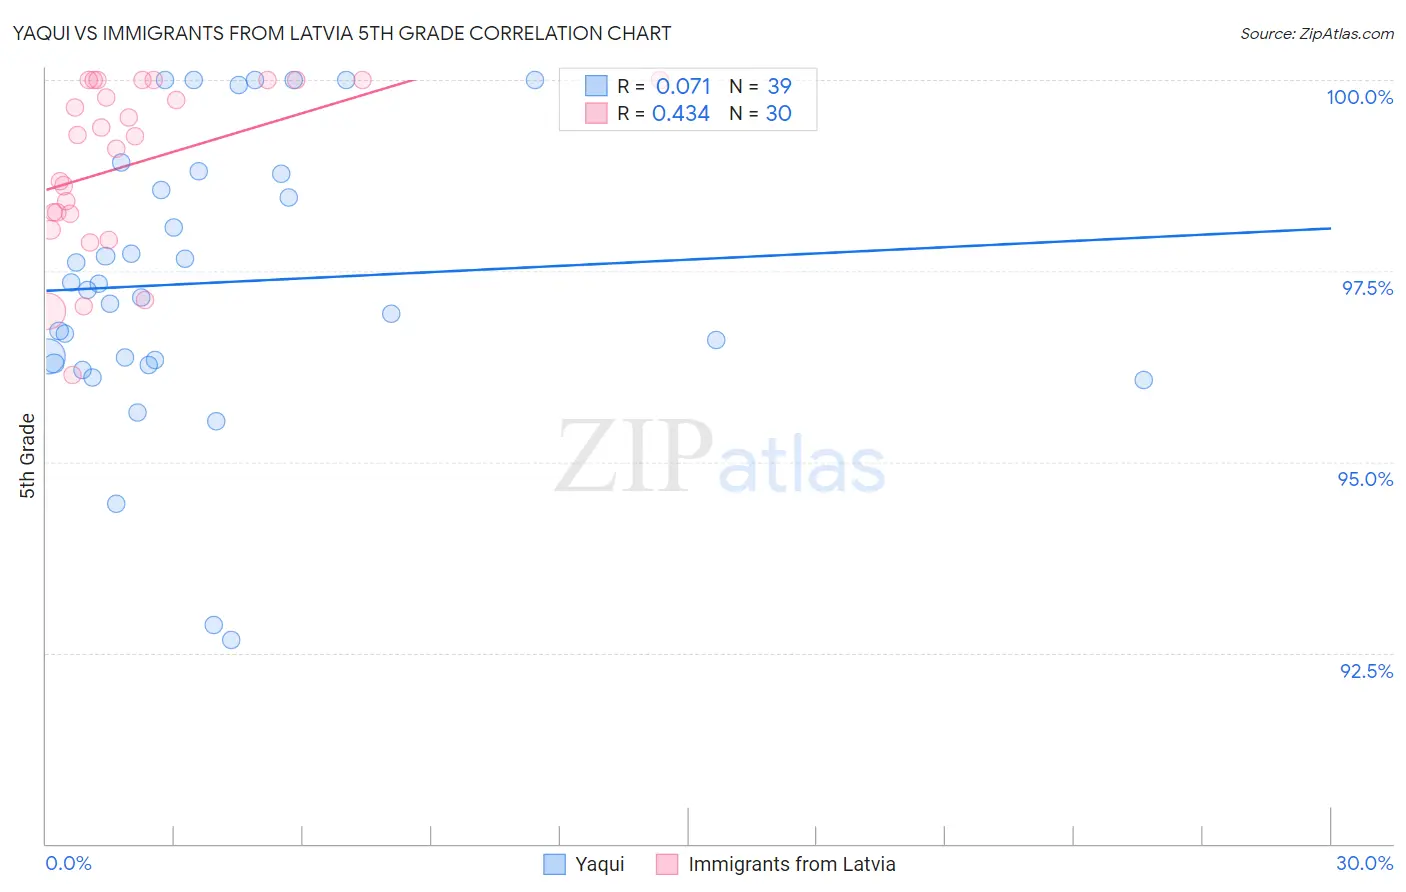
Yaqui vs Immigrants from Latvia 5th Grade Correlation Chart
The statistical analysis conducted on geographies consisting of 107,725,021 people shows a slight positive correlation between the proportion of Yaqui and percentage of population with at least 5th grade education in the United States with a correlation coefficient (R) of 0.071 and weighted average of 96.7%. Similarly, the statistical analysis conducted on geographies consisting of 113,724,291 people shows a moderate positive correlation between the proportion of Immigrants from Latvia and percentage of population with at least 5th grade education in the United States with a correlation coefficient (R) of 0.434 and weighted average of 97.7%, a difference of 1.1%.
5th Grade Correlation Summary
| Measurement | Yaqui | Immigrants from Latvia |
| Minimum | 92.7% | 96.1% |
| Maximum | 100.0% | 100.0% |
| Range | 7.3% | 3.9% |
| Mean | 97.3% | 98.9% |
| Median | 97.2% | 99.3% |
| Interquartile 25% (IQ1) | 96.3% | 98.3% |
| Interquartile 75% (IQ3) | 98.8% | 100.0% |
| Interquartile Range (IQR) | 2.5% | 1.7% |
| Standard Deviation (Sample) | 1.8% | 1.1% |
| Standard Deviation (Population) | 1.8% | 1.1% |
Similar Demographics by 5th Grade
Demographics Similar to Yaqui by 5th Grade
In terms of 5th grade, the demographic groups most similar to Yaqui are Immigrants from Cameroon (96.7%, a difference of 0.0%), Trinidadian and Tobagonian (96.7%, a difference of 0.010%), Immigrants from Peru (96.6%, a difference of 0.010%), Cuban (96.6%, a difference of 0.010%), and Immigrants from Bolivia (96.6%, a difference of 0.010%).
| Demographics | Rating | Rank | 5th Grade |
| Immigrants | Nigeria | 0.3 /100 | #266 | Tragic 96.7% |
| Immigrants | South America | 0.3 /100 | #267 | Tragic 96.7% |
| Armenians | 0.3 /100 | #268 | Tragic 96.7% |
| Ghanaians | 0.2 /100 | #269 | Tragic 96.7% |
| Afghans | 0.2 /100 | #270 | Tragic 96.7% |
| Immigrants | Hong Kong | 0.2 /100 | #271 | Tragic 96.7% |
| Trinidadians and Tobagonians | 0.1 /100 | #272 | Tragic 96.7% |
| Yaqui | 0.1 /100 | #273 | Tragic 96.7% |
| Immigrants | Cameroon | 0.1 /100 | #274 | Tragic 96.7% |
| Immigrants | Peru | 0.1 /100 | #275 | Tragic 96.6% |
| Cubans | 0.1 /100 | #276 | Tragic 96.6% |
| Immigrants | Bolivia | 0.1 /100 | #277 | Tragic 96.6% |
| Immigrants | Ghana | 0.1 /100 | #278 | Tragic 96.6% |
| Immigrants | Philippines | 0.1 /100 | #279 | Tragic 96.6% |
| Immigrants | Western Africa | 0.1 /100 | #280 | Tragic 96.6% |
Demographics Similar to Immigrants from Latvia by 5th Grade
In terms of 5th grade, the demographic groups most similar to Immigrants from Latvia are Nonimmigrants (97.7%, a difference of 0.010%), Thai (97.7%, a difference of 0.010%), Bhutanese (97.7%, a difference of 0.020%), Immigrants from Czechoslovakia (97.7%, a difference of 0.020%), and Immigrants from Singapore (97.7%, a difference of 0.020%).
| Demographics | Rating | Rank | 5th Grade |
| Choctaw | 98.0 /100 | #102 | Exceptional 97.7% |
| Cheyenne | 97.9 /100 | #103 | Exceptional 97.7% |
| German Russians | 97.8 /100 | #104 | Exceptional 97.7% |
| Bhutanese | 97.6 /100 | #105 | Exceptional 97.7% |
| Immigrants | Czechoslovakia | 97.5 /100 | #106 | Exceptional 97.7% |
| Immigrants | Singapore | 97.5 /100 | #107 | Exceptional 97.7% |
| Immigrants | Nonimmigrants | 97.3 /100 | #108 | Exceptional 97.7% |
| Immigrants | Latvia | 97.1 /100 | #109 | Exceptional 97.7% |
| Thais | 96.9 /100 | #110 | Exceptional 97.7% |
| Menominee | 96.3 /100 | #111 | Exceptional 97.7% |
| Immigrants | Switzerland | 96.0 /100 | #112 | Exceptional 97.7% |
| Iroquois | 95.9 /100 | #113 | Exceptional 97.7% |
| Lebanese | 95.7 /100 | #114 | Exceptional 97.6% |
| Okinawans | 95.7 /100 | #115 | Exceptional 97.6% |
| Immigrants | Croatia | 95.5 /100 | #116 | Exceptional 97.6% |