Tlingit-Haida vs Immigrants from Latvia Median Male Earnings
COMPARE
Tlingit-Haida
Immigrants from Latvia
Median Male Earnings
Median Male Earnings Comparison
Tlingit-Haida
Immigrants from Latvia
$52,409
MEDIAN MALE EARNINGS
11.5/ 100
METRIC RATING
211th/ 347
METRIC RANK
$61,422
MEDIAN MALE EARNINGS
99.9/ 100
METRIC RATING
54th/ 347
METRIC RANK
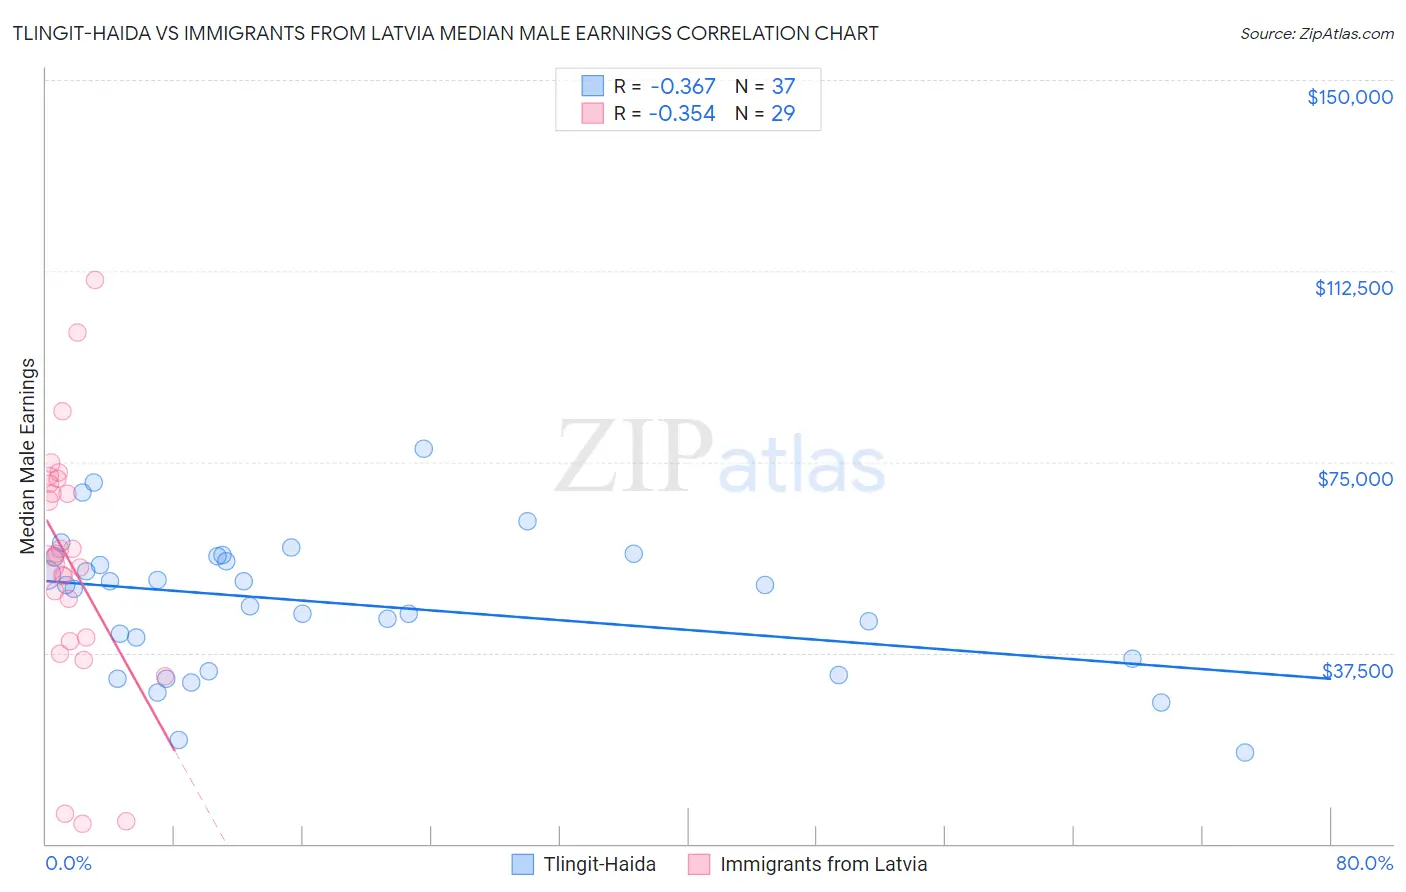
Tlingit-Haida vs Immigrants from Latvia Median Male Earnings Correlation Chart
The statistical analysis conducted on geographies consisting of 60,863,896 people shows a mild negative correlation between the proportion of Tlingit-Haida and median male earnings in the United States with a correlation coefficient (R) of -0.367 and weighted average of $52,409. Similarly, the statistical analysis conducted on geographies consisting of 113,724,849 people shows a mild negative correlation between the proportion of Immigrants from Latvia and median male earnings in the United States with a correlation coefficient (R) of -0.354 and weighted average of $61,422, a difference of 17.2%.
Median Male Earnings Correlation Summary
| Measurement | Tlingit-Haida | Immigrants from Latvia |
| Minimum | $17,917 | $3,900 |
| Maximum | $77,679 | $110,833 |
| Range | $59,762 | $106,933 |
| Mean | $47,277 | $55,354 |
| Median | $50,705 | $56,127 |
| Interquartile 25% (IQ1) | $35,036 | $40,143 |
| Interquartile 75% (IQ3) | $56,386 | $71,183 |
| Interquartile Range (IQR) | $21,350 | $31,039 |
| Standard Deviation (Sample) | $13,635 | $24,947 |
| Standard Deviation (Population) | $13,450 | $24,513 |
Similar Demographics by Median Male Earnings
Demographics Similar to Tlingit-Haida by Median Male Earnings
In terms of median male earnings, the demographic groups most similar to Tlingit-Haida are Delaware ($52,412, a difference of 0.010%), Bermudan ($52,465, a difference of 0.11%), Cajun ($52,325, a difference of 0.16%), Venezuelan ($52,510, a difference of 0.19%), and Native Hawaiian ($52,306, a difference of 0.20%).
| Demographics | Rating | Rank | Median Male Earnings |
| Ghanaians | 16.1 /100 | #204 | Poor $52,810 |
| Immigrants | Colombia | 15.0 /100 | #205 | Poor $52,725 |
| Immigrants | Iraq | 14.5 /100 | #206 | Poor $52,681 |
| Vietnamese | 12.7 /100 | #207 | Poor $52,525 |
| Venezuelans | 12.5 /100 | #208 | Poor $52,510 |
| Bermudans | 12.1 /100 | #209 | Poor $52,465 |
| Delaware | 11.5 /100 | #210 | Poor $52,412 |
| Tlingit-Haida | 11.5 /100 | #211 | Poor $52,409 |
| Cajuns | 10.7 /100 | #212 | Poor $52,325 |
| Native Hawaiians | 10.5 /100 | #213 | Poor $52,306 |
| Immigrants | Nonimmigrants | 9.3 /100 | #214 | Tragic $52,170 |
| Immigrants | Cameroon | 8.9 /100 | #215 | Tragic $52,119 |
| Immigrants | Venezuela | 8.3 /100 | #216 | Tragic $52,041 |
| Nigerians | 8.3 /100 | #217 | Tragic $52,039 |
| Immigrants | Panama | 7.7 /100 | #218 | Tragic $51,962 |
Demographics Similar to Immigrants from Latvia by Median Male Earnings
In terms of median male earnings, the demographic groups most similar to Immigrants from Latvia are South African ($61,460, a difference of 0.060%), Greek ($61,242, a difference of 0.29%), Lithuanian ($61,228, a difference of 0.32%), Immigrants from Scotland ($61,220, a difference of 0.33%), and Immigrants from Norway ($61,628, a difference of 0.34%).
| Demographics | Rating | Rank | Median Male Earnings |
| Immigrants | Austria | 99.9 /100 | #47 | Exceptional $62,164 |
| Immigrants | Malaysia | 99.9 /100 | #48 | Exceptional $62,121 |
| Immigrants | Europe | 99.9 /100 | #49 | Exceptional $62,057 |
| Bhutanese | 99.9 /100 | #50 | Exceptional $61,759 |
| Estonians | 99.9 /100 | #51 | Exceptional $61,710 |
| Immigrants | Norway | 99.9 /100 | #52 | Exceptional $61,628 |
| South Africans | 99.9 /100 | #53 | Exceptional $61,460 |
| Immigrants | Latvia | 99.9 /100 | #54 | Exceptional $61,422 |
| Greeks | 99.9 /100 | #55 | Exceptional $61,242 |
| Lithuanians | 99.9 /100 | #56 | Exceptional $61,228 |
| Immigrants | Scotland | 99.9 /100 | #57 | Exceptional $61,220 |
| New Zealanders | 99.9 /100 | #58 | Exceptional $61,199 |
| Immigrants | Netherlands | 99.8 /100 | #59 | Exceptional $61,096 |
| Egyptians | 99.8 /100 | #60 | Exceptional $61,095 |
| Bolivians | 99.8 /100 | #61 | Exceptional $61,066 |