Native Hawaiian vs Immigrants from Armenia Median Family Income
COMPARE
Native Hawaiian
Immigrants from Armenia
Median Family Income
Median Family Income Comparison
Native Hawaiians
Immigrants from Armenia
$104,910
MEDIAN FAMILY INCOME
75.8/ 100
METRIC RATING
155th/ 347
METRIC RANK
$97,605
MEDIAN FAMILY INCOME
7.0/ 100
METRIC RATING
213th/ 347
METRIC RANK
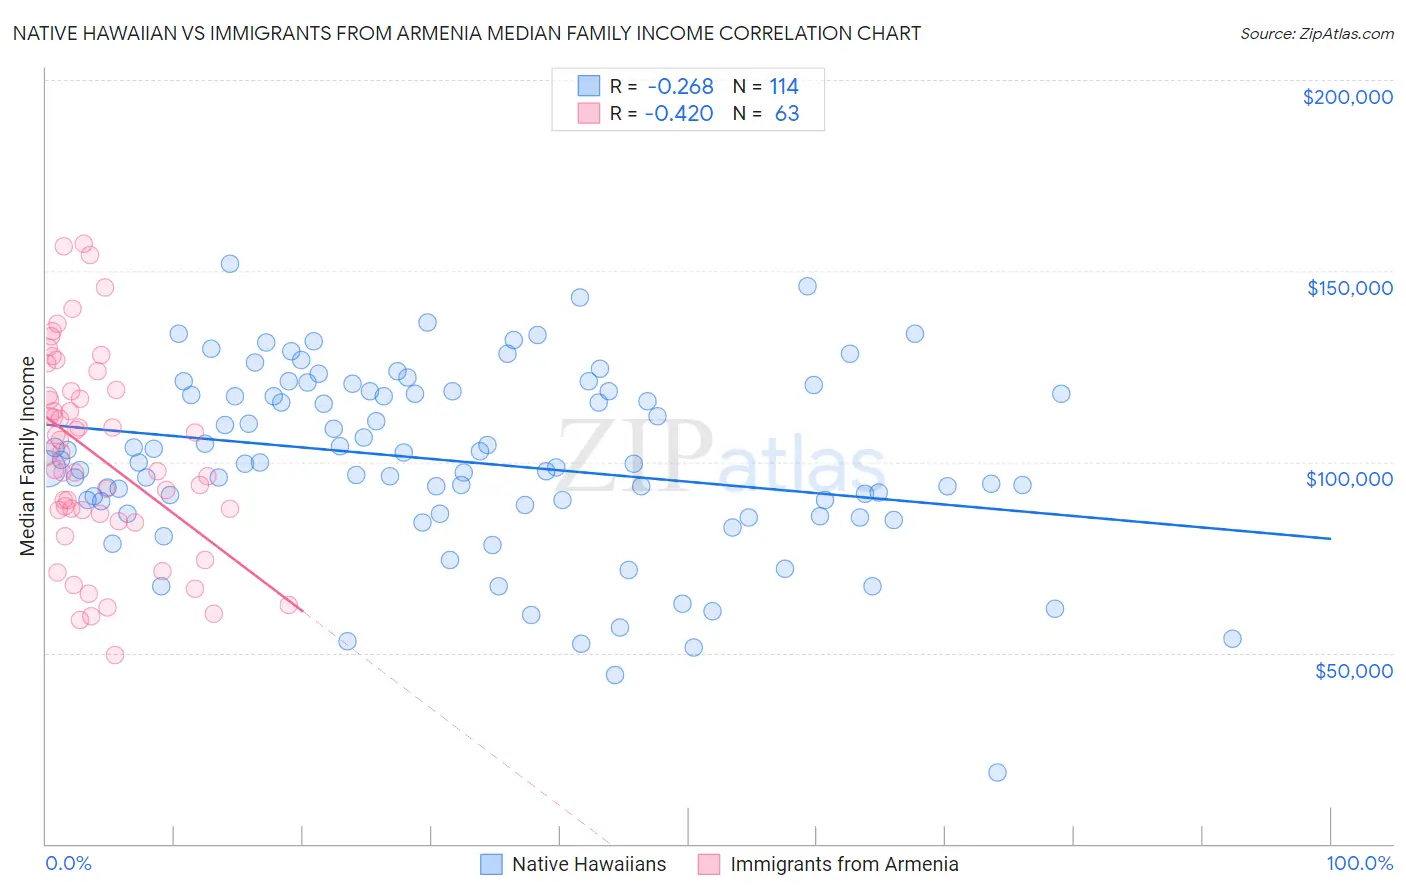
Native Hawaiian vs Immigrants from Armenia Median Family Income Correlation Chart
The statistical analysis conducted on geographies consisting of 331,783,011 people shows a weak negative correlation between the proportion of Native Hawaiians and median family income in the United States with a correlation coefficient (R) of -0.268 and weighted average of $104,910. Similarly, the statistical analysis conducted on geographies consisting of 97,713,870 people shows a moderate negative correlation between the proportion of Immigrants from Armenia and median family income in the United States with a correlation coefficient (R) of -0.420 and weighted average of $97,605, a difference of 7.5%.
Median Family Income Correlation Summary
| Measurement | Native Hawaiian | Immigrants from Armenia |
| Minimum | $18,796 | $49,583 |
| Maximum | $151,740 | $157,199 |
| Range | $132,944 | $107,616 |
| Mean | $100,179 | $101,713 |
| Median | $99,798 | $102,061 |
| Interquartile 25% (IQ1) | $88,761 | $86,292 |
| Interquartile 75% (IQ3) | $118,333 | $118,550 |
| Interquartile Range (IQR) | $29,572 | $32,258 |
| Standard Deviation (Sample) | $23,926 | $25,932 |
| Standard Deviation (Population) | $23,821 | $25,725 |
Similar Demographics by Median Family Income
Demographics Similar to Native Hawaiians by Median Family Income
In terms of median family income, the demographic groups most similar to Native Hawaiians are Immigrants from Nepal ($104,966, a difference of 0.050%), Basque ($104,760, a difference of 0.14%), Slavic ($105,144, a difference of 0.22%), Immigrants from Albania ($105,285, a difference of 0.36%), and Moroccan ($104,488, a difference of 0.40%).
| Demographics | Rating | Rank | Median Family Income |
| Hungarians | 81.7 /100 | #148 | Excellent $105,609 |
| Immigrants | Germany | 80.9 /100 | #149 | Excellent $105,507 |
| Irish | 80.5 /100 | #150 | Excellent $105,453 |
| Peruvians | 80.4 /100 | #151 | Excellent $105,444 |
| Immigrants | Albania | 79.1 /100 | #152 | Good $105,285 |
| Slavs | 77.9 /100 | #153 | Good $105,144 |
| Immigrants | Nepal | 76.3 /100 | #154 | Good $104,966 |
| Native Hawaiians | 75.8 /100 | #155 | Good $104,910 |
| Basques | 74.4 /100 | #156 | Good $104,760 |
| Moroccans | 71.6 /100 | #157 | Good $104,488 |
| Scandinavians | 70.8 /100 | #158 | Good $104,410 |
| Swiss | 70.7 /100 | #159 | Good $104,396 |
| Scottish | 69.5 /100 | #160 | Good $104,288 |
| Icelanders | 69.4 /100 | #161 | Good $104,282 |
| Immigrants | Sierra Leone | 66.2 /100 | #162 | Good $103,990 |
Demographics Similar to Immigrants from Armenia by Median Family Income
In terms of median family income, the demographic groups most similar to Immigrants from Armenia are Bermudan ($97,577, a difference of 0.030%), Panamanian ($97,683, a difference of 0.080%), Nigerian ($97,522, a difference of 0.090%), Immigrants from Sudan ($97,737, a difference of 0.13%), and Immigrants from Bosnia and Herzegovina ($97,432, a difference of 0.18%).
| Demographics | Rating | Rank | Median Family Income |
| Immigrants | Iraq | 12.1 /100 | #206 | Poor $98,786 |
| Aleuts | 11.6 /100 | #207 | Poor $98,702 |
| Immigrants | Uruguay | 9.2 /100 | #208 | Tragic $98,205 |
| Immigrants | Colombia | 8.7 /100 | #209 | Tragic $98,067 |
| Puget Sound Salish | 8.2 /100 | #210 | Tragic $97,958 |
| Immigrants | Sudan | 7.4 /100 | #211 | Tragic $97,737 |
| Panamanians | 7.2 /100 | #212 | Tragic $97,683 |
| Immigrants | Armenia | 7.0 /100 | #213 | Tragic $97,605 |
| Bermudans | 6.9 /100 | #214 | Tragic $97,577 |
| Nigerians | 6.7 /100 | #215 | Tragic $97,522 |
| Immigrants | Bosnia and Herzegovina | 6.4 /100 | #216 | Tragic $97,432 |
| Japanese | 6.0 /100 | #217 | Tragic $97,288 |
| Immigrants | Cambodia | 5.8 /100 | #218 | Tragic $97,222 |
| Delaware | 5.1 /100 | #219 | Tragic $96,958 |
| Sudanese | 4.7 /100 | #220 | Tragic $96,783 |