Yaqui vs Alaskan Athabascan Median Household Income
COMPARE
Yaqui
Alaskan Athabascan
Median Household Income
Median Household Income Comparison
Yaqui
Alaskan Athabascans
$74,596
MEDIAN HOUSEHOLD INCOME
0.1/ 100
METRIC RATING
284th/ 347
METRIC RANK
$76,383
MEDIAN HOUSEHOLD INCOME
0.4/ 100
METRIC RATING
263rd/ 347
METRIC RANK
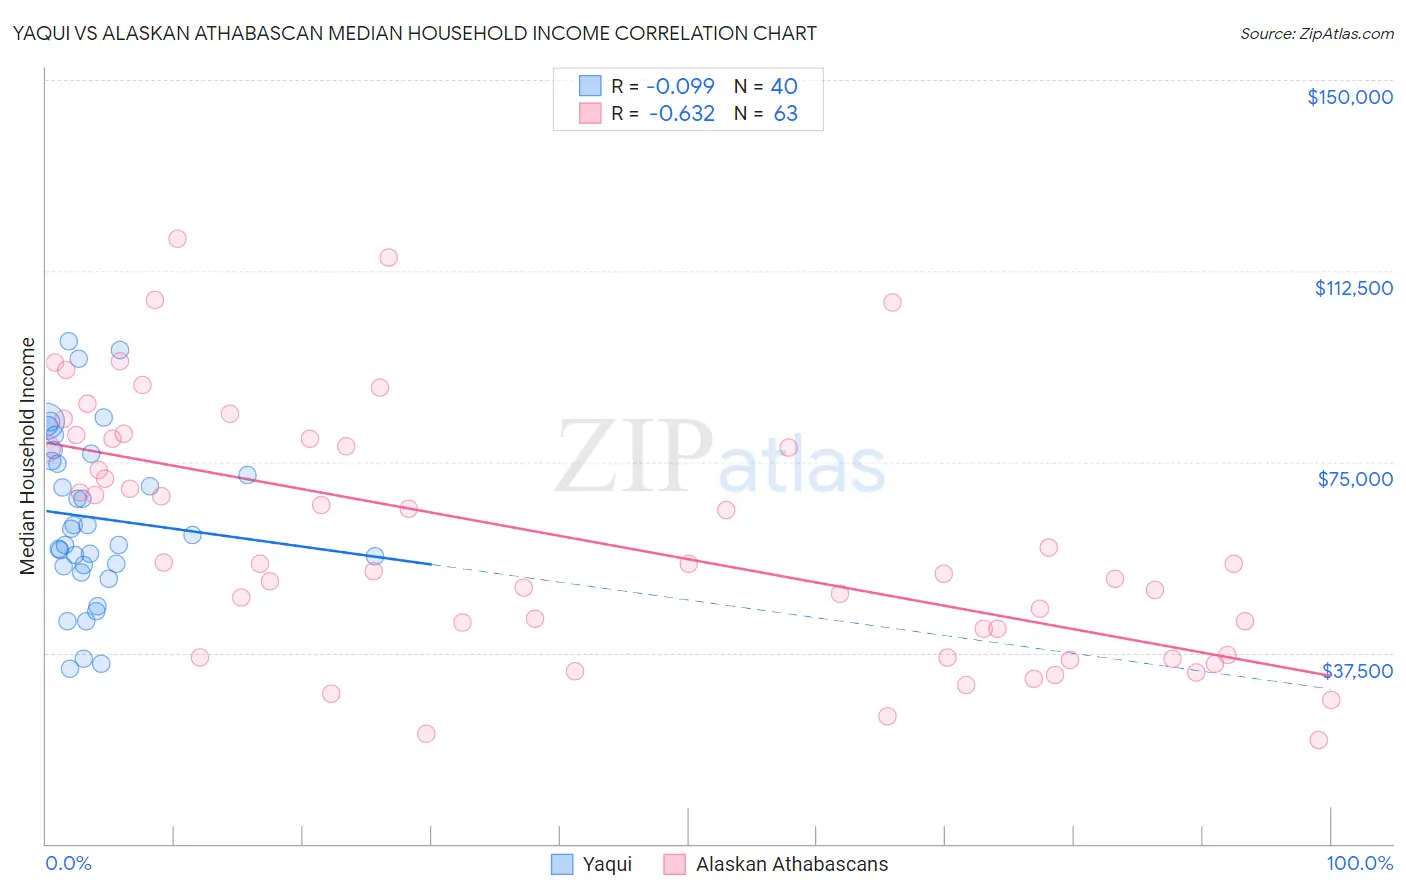
Yaqui vs Alaskan Athabascan Median Household Income Correlation Chart
The statistical analysis conducted on geographies consisting of 107,719,305 people shows a slight negative correlation between the proportion of Yaqui and median household income in the United States with a correlation coefficient (R) of -0.099 and weighted average of $74,596. Similarly, the statistical analysis conducted on geographies consisting of 45,812,420 people shows a significant negative correlation between the proportion of Alaskan Athabascans and median household income in the United States with a correlation coefficient (R) of -0.632 and weighted average of $76,383, a difference of 2.4%.
Median Household Income Correlation Summary
| Measurement | Yaqui | Alaskan Athabascan |
| Minimum | $34,415 | $20,417 |
| Maximum | $98,754 | $118,934 |
| Range | $64,339 | $98,517 |
| Mean | $64,033 | $60,171 |
| Median | $61,231 | $55,000 |
| Interquartile 25% (IQ1) | $54,573 | $36,964 |
| Interquartile 75% (IQ3) | $75,863 | $79,438 |
| Interquartile Range (IQR) | $21,290 | $42,474 |
| Standard Deviation (Sample) | $16,401 | $24,397 |
| Standard Deviation (Population) | $16,195 | $24,203 |
Similar Demographics by Median Household Income
Demographics Similar to Yaqui by Median Household Income
In terms of median household income, the demographic groups most similar to Yaqui are Cree ($74,685, a difference of 0.12%), Mexican ($74,399, a difference of 0.26%), Central American Indian ($74,847, a difference of 0.34%), Immigrants from Liberia ($74,896, a difference of 0.40%), and Immigrants from Somalia ($74,300, a difference of 0.40%).
| Demographics | Rating | Rank | Median Household Income |
| Spanish Americans | 0.2 /100 | #277 | Tragic $75,386 |
| Osage | 0.2 /100 | #278 | Tragic $75,240 |
| Immigrants | Guatemala | 0.2 /100 | #279 | Tragic $75,123 |
| Senegalese | 0.2 /100 | #280 | Tragic $74,999 |
| Immigrants | Liberia | 0.1 /100 | #281 | Tragic $74,896 |
| Central American Indians | 0.1 /100 | #282 | Tragic $74,847 |
| Cree | 0.1 /100 | #283 | Tragic $74,685 |
| Yaqui | 0.1 /100 | #284 | Tragic $74,596 |
| Mexicans | 0.1 /100 | #285 | Tragic $74,399 |
| Immigrants | Somalia | 0.1 /100 | #286 | Tragic $74,300 |
| Iroquois | 0.1 /100 | #287 | Tragic $74,279 |
| Immigrants | Central America | 0.1 /100 | #288 | Tragic $74,217 |
| Fijians | 0.1 /100 | #289 | Tragic $74,205 |
| Bangladeshis | 0.1 /100 | #290 | Tragic $74,112 |
| Hispanics or Latinos | 0.1 /100 | #291 | Tragic $73,823 |
Demographics Similar to Alaskan Athabascans by Median Household Income
In terms of median household income, the demographic groups most similar to Alaskan Athabascans are French American Indian ($76,387, a difference of 0.010%), Immigrants from Grenada ($76,517, a difference of 0.18%), Jamaican ($76,583, a difference of 0.26%), Spanish American Indian ($76,670, a difference of 0.38%), and Immigrants from Nicaragua ($76,784, a difference of 0.52%).
| Demographics | Rating | Rank | Median Household Income |
| Belizeans | 0.6 /100 | #256 | Tragic $77,028 |
| Immigrants | Senegal | 0.5 /100 | #257 | Tragic $76,915 |
| Immigrants | Nicaragua | 0.5 /100 | #258 | Tragic $76,784 |
| Spanish American Indians | 0.4 /100 | #259 | Tragic $76,670 |
| Jamaicans | 0.4 /100 | #260 | Tragic $76,583 |
| Immigrants | Grenada | 0.4 /100 | #261 | Tragic $76,517 |
| French American Indians | 0.4 /100 | #262 | Tragic $76,387 |
| Alaskan Athabascans | 0.4 /100 | #263 | Tragic $76,383 |
| Guatemalans | 0.3 /100 | #264 | Tragic $75,961 |
| Immigrants | Belize | 0.3 /100 | #265 | Tragic $75,938 |
| Americans | 0.3 /100 | #266 | Tragic $75,932 |
| German Russians | 0.3 /100 | #267 | Tragic $75,856 |
| Immigrants | Jamaica | 0.3 /100 | #268 | Tragic $75,851 |
| Cape Verdeans | 0.3 /100 | #269 | Tragic $75,848 |
| Hmong | 0.3 /100 | #270 | Tragic $75,839 |