Yaqui vs Icelander Median Household Income
COMPARE
Yaqui
Icelander
Median Household Income
Median Household Income Comparison
Yaqui
Icelanders
$74,596
MEDIAN HOUSEHOLD INCOME
0.1/ 100
METRIC RATING
284th/ 347
METRIC RANK
$85,797
MEDIAN HOUSEHOLD INCOME
61.0/ 100
METRIC RATING
168th/ 347
METRIC RANK
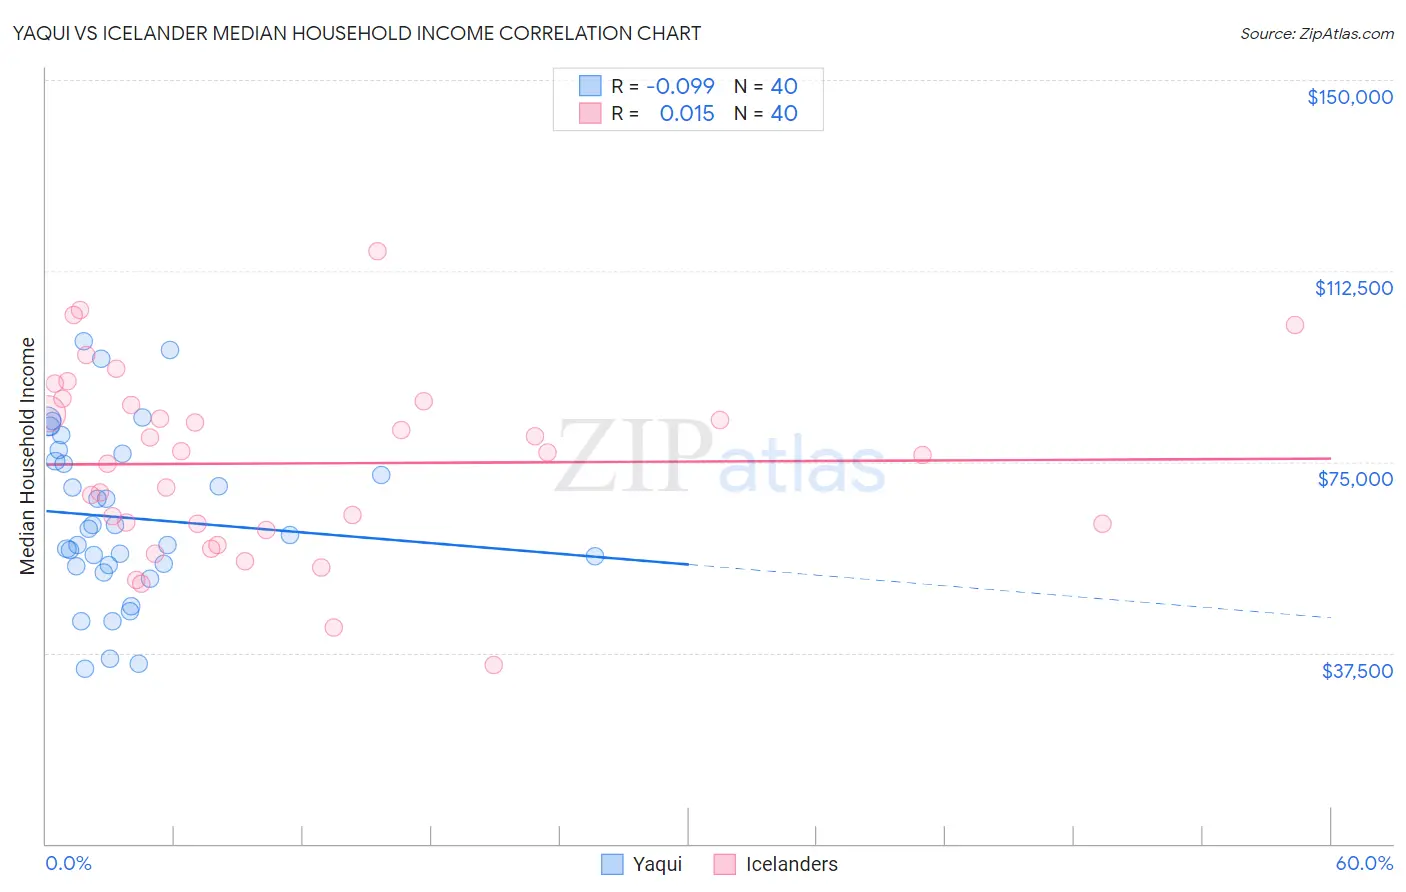
Yaqui vs Icelander Median Household Income Correlation Chart
The statistical analysis conducted on geographies consisting of 107,719,305 people shows a slight negative correlation between the proportion of Yaqui and median household income in the United States with a correlation coefficient (R) of -0.099 and weighted average of $74,596. Similarly, the statistical analysis conducted on geographies consisting of 159,599,934 people shows no correlation between the proportion of Icelanders and median household income in the United States with a correlation coefficient (R) of 0.015 and weighted average of $85,797, a difference of 15.0%.
Median Household Income Correlation Summary
| Measurement | Yaqui | Icelander |
| Minimum | $34,415 | $35,179 |
| Maximum | $98,754 | $116,250 |
| Range | $64,339 | $81,071 |
| Mean | $64,033 | $74,702 |
| Median | $61,231 | $76,562 |
| Interquartile 25% (IQ1) | $54,573 | $62,204 |
| Interquartile 75% (IQ3) | $75,863 | $86,541 |
| Interquartile Range (IQR) | $21,290 | $24,337 |
| Standard Deviation (Sample) | $16,401 | $17,966 |
| Standard Deviation (Population) | $16,195 | $17,740 |
Similar Demographics by Median Household Income
Demographics Similar to Yaqui by Median Household Income
In terms of median household income, the demographic groups most similar to Yaqui are Cree ($74,685, a difference of 0.12%), Mexican ($74,399, a difference of 0.26%), Central American Indian ($74,847, a difference of 0.34%), Immigrants from Liberia ($74,896, a difference of 0.40%), and Immigrants from Somalia ($74,300, a difference of 0.40%).
| Demographics | Rating | Rank | Median Household Income |
| Spanish Americans | 0.2 /100 | #277 | Tragic $75,386 |
| Osage | 0.2 /100 | #278 | Tragic $75,240 |
| Immigrants | Guatemala | 0.2 /100 | #279 | Tragic $75,123 |
| Senegalese | 0.2 /100 | #280 | Tragic $74,999 |
| Immigrants | Liberia | 0.1 /100 | #281 | Tragic $74,896 |
| Central American Indians | 0.1 /100 | #282 | Tragic $74,847 |
| Cree | 0.1 /100 | #283 | Tragic $74,685 |
| Yaqui | 0.1 /100 | #284 | Tragic $74,596 |
| Mexicans | 0.1 /100 | #285 | Tragic $74,399 |
| Immigrants | Somalia | 0.1 /100 | #286 | Tragic $74,300 |
| Iroquois | 0.1 /100 | #287 | Tragic $74,279 |
| Immigrants | Central America | 0.1 /100 | #288 | Tragic $74,217 |
| Fijians | 0.1 /100 | #289 | Tragic $74,205 |
| Bangladeshis | 0.1 /100 | #290 | Tragic $74,112 |
| Hispanics or Latinos | 0.1 /100 | #291 | Tragic $73,823 |
Demographics Similar to Icelanders by Median Household Income
In terms of median household income, the demographic groups most similar to Icelanders are Immigrants ($85,818, a difference of 0.020%), Colombian ($85,716, a difference of 0.090%), Swiss ($85,681, a difference of 0.14%), Immigrants from South America ($85,611, a difference of 0.22%), and Slovene ($85,562, a difference of 0.27%).
| Demographics | Rating | Rank | Median Household Income |
| Slavs | 69.7 /100 | #161 | Good $86,398 |
| Guamanians/Chamorros | 67.7 /100 | #162 | Good $86,255 |
| Czechs | 66.4 /100 | #163 | Good $86,164 |
| Irish | 66.2 /100 | #164 | Good $86,145 |
| Norwegians | 65.3 /100 | #165 | Good $86,084 |
| Scandinavians | 65.1 /100 | #166 | Good $86,073 |
| Immigrants | Immigrants | 61.3 /100 | #167 | Good $85,818 |
| Icelanders | 61.0 /100 | #168 | Good $85,797 |
| Colombians | 59.7 /100 | #169 | Average $85,716 |
| Swiss | 59.2 /100 | #170 | Average $85,681 |
| Immigrants | South America | 58.1 /100 | #171 | Average $85,611 |
| Slovenes | 57.4 /100 | #172 | Average $85,562 |
| Immigrants | Cameroon | 53.4 /100 | #173 | Average $85,314 |
| Scottish | 50.0 /100 | #174 | Average $85,101 |
| Immigrants | Costa Rica | 49.2 /100 | #175 | Average $85,054 |