Canadian vs Immigrants from Eastern Europe Median Household Income
COMPARE
Canadian
Immigrants from Eastern Europe
Median Household Income
Median Household Income Comparison
Canadians
Immigrants from Eastern Europe
$87,769
MEDIAN HOUSEHOLD INCOME
84.7/ 100
METRIC RATING
142nd/ 347
METRIC RANK
$93,051
MEDIAN HOUSEHOLD INCOME
99.4/ 100
METRIC RATING
81st/ 347
METRIC RANK
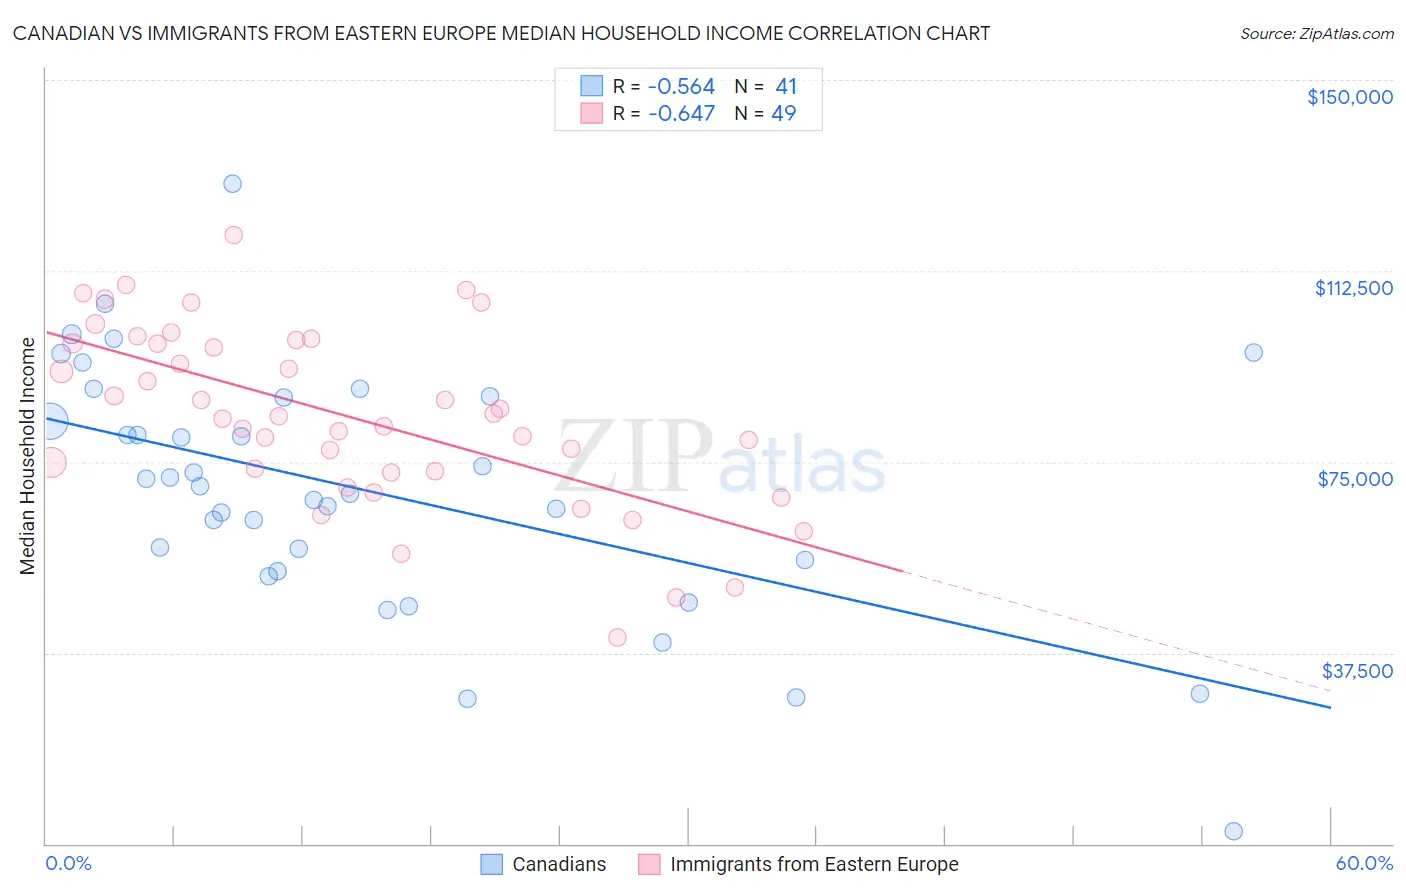
Canadian vs Immigrants from Eastern Europe Median Household Income Correlation Chart
The statistical analysis conducted on geographies consisting of 437,190,973 people shows a substantial negative correlation between the proportion of Canadians and median household income in the United States with a correlation coefficient (R) of -0.564 and weighted average of $87,769. Similarly, the statistical analysis conducted on geographies consisting of 475,370,046 people shows a significant negative correlation between the proportion of Immigrants from Eastern Europe and median household income in the United States with a correlation coefficient (R) of -0.647 and weighted average of $93,051, a difference of 6.0%.
Median Household Income Correlation Summary
| Measurement | Canadian | Immigrants from Eastern Europe |
| Minimum | $2,499 | $40,467 |
| Maximum | $129,644 | $119,517 |
| Range | $127,145 | $79,050 |
| Mean | $69,441 | $84,121 |
| Median | $70,262 | $83,863 |
| Interquartile 25% (IQ1) | $54,608 | $72,994 |
| Interquartile 75% (IQ3) | $87,722 | $98,652 |
| Interquartile Range (IQR) | $33,114 | $25,658 |
| Standard Deviation (Sample) | $24,486 | $17,573 |
| Standard Deviation (Population) | $24,185 | $17,393 |
Similar Demographics by Median Household Income
Demographics Similar to Canadians by Median Household Income
In terms of median household income, the demographic groups most similar to Canadians are Danish ($87,676, a difference of 0.11%), Immigrants from Morocco ($87,930, a difference of 0.18%), Serbian ($87,572, a difference of 0.22%), Ugandan ($87,557, a difference of 0.24%), and Immigrants from Uganda ($87,553, a difference of 0.25%).
| Demographics | Rating | Rank | Median Household Income |
| Immigrants | Sierra Leone | 89.9 /100 | #135 | Excellent $88,498 |
| Poles | 89.7 /100 | #136 | Excellent $88,472 |
| Sierra Leoneans | 89.6 /100 | #137 | Excellent $88,463 |
| Arabs | 89.2 /100 | #138 | Excellent $88,398 |
| Immigrants | Chile | 89.2 /100 | #139 | Excellent $88,388 |
| Lebanese | 87.2 /100 | #140 | Excellent $88,091 |
| Immigrants | Morocco | 86.0 /100 | #141 | Excellent $87,930 |
| Canadians | 84.7 /100 | #142 | Excellent $87,769 |
| Danes | 83.9 /100 | #143 | Excellent $87,676 |
| Serbians | 83.0 /100 | #144 | Excellent $87,572 |
| Ugandans | 82.9 /100 | #145 | Excellent $87,557 |
| Immigrants | Uganda | 82.8 /100 | #146 | Excellent $87,553 |
| South American Indians | 81.8 /100 | #147 | Excellent $87,446 |
| Costa Ricans | 80.0 /100 | #148 | Excellent $87,262 |
| Immigrants | Nepal | 77.7 /100 | #149 | Good $87,046 |
Demographics Similar to Immigrants from Eastern Europe by Median Household Income
In terms of median household income, the demographic groups most similar to Immigrants from Eastern Europe are Tongan ($93,076, a difference of 0.030%), Sri Lankan ($93,093, a difference of 0.050%), Immigrants from Bulgaria ($93,148, a difference of 0.10%), Immigrants from Spain ($92,732, a difference of 0.34%), and South African ($93,379, a difference of 0.35%).
| Demographics | Rating | Rank | Median Household Income |
| Immigrants | Latvia | 99.6 /100 | #74 | Exceptional $93,602 |
| Immigrants | Italy | 99.5 /100 | #75 | Exceptional $93,465 |
| South Africans | 99.5 /100 | #76 | Exceptional $93,379 |
| Immigrants | Afghanistan | 99.5 /100 | #77 | Exceptional $93,375 |
| Immigrants | Bulgaria | 99.4 /100 | #78 | Exceptional $93,148 |
| Sri Lankans | 99.4 /100 | #79 | Exceptional $93,093 |
| Tongans | 99.4 /100 | #80 | Exceptional $93,076 |
| Immigrants | Eastern Europe | 99.4 /100 | #81 | Exceptional $93,051 |
| Immigrants | Spain | 99.3 /100 | #82 | Exceptional $92,732 |
| Italians | 99.1 /100 | #83 | Exceptional $92,475 |
| Immigrants | Argentina | 99.1 /100 | #84 | Exceptional $92,417 |
| Immigrants | Croatia | 99.0 /100 | #85 | Exceptional $92,225 |
| Immigrants | England | 98.9 /100 | #86 | Exceptional $92,098 |
| Immigrants | Hungary | 98.9 /100 | #87 | Exceptional $92,094 |
| Immigrants | Canada | 98.8 /100 | #88 | Exceptional $92,029 |