Yakama vs Immigrants from Eastern Europe Median Earnings
COMPARE
Yakama
Immigrants from Eastern Europe
Median Earnings
Median Earnings Comparison
Yakama
Immigrants from Eastern Europe
$39,107
MEDIAN EARNINGS
0.0/ 100
METRIC RATING
332nd/ 347
METRIC RANK
$51,624
MEDIAN EARNINGS
99.9/ 100
METRIC RATING
57th/ 347
METRIC RANK
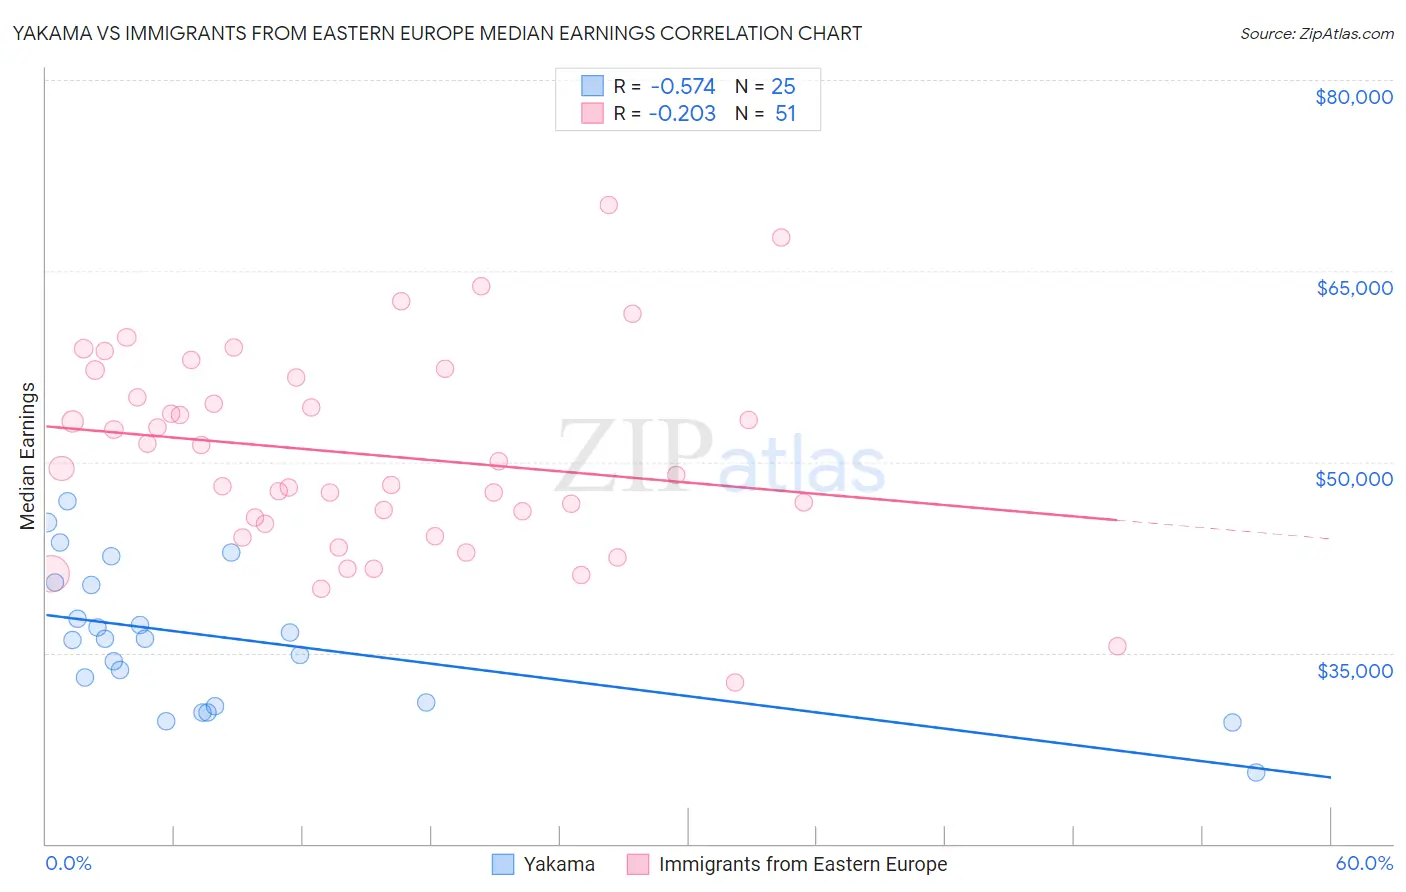
Yakama vs Immigrants from Eastern Europe Median Earnings Correlation Chart
The statistical analysis conducted on geographies consisting of 19,920,783 people shows a substantial negative correlation between the proportion of Yakama and median earnings in the United States with a correlation coefficient (R) of -0.574 and weighted average of $39,107. Similarly, the statistical analysis conducted on geographies consisting of 475,833,062 people shows a weak negative correlation between the proportion of Immigrants from Eastern Europe and median earnings in the United States with a correlation coefficient (R) of -0.203 and weighted average of $51,624, a difference of 32.0%.
Median Earnings Correlation Summary
| Measurement | Yakama | Immigrants from Eastern Europe |
| Minimum | $25,625 | $32,703 |
| Maximum | $46,951 | $70,148 |
| Range | $21,326 | $37,445 |
| Mean | $36,082 | $50,592 |
| Median | $36,058 | $49,479 |
| Interquartile 25% (IQ1) | $30,946 | $45,140 |
| Interquartile 75% (IQ3) | $40,418 | $56,614 |
| Interquartile Range (IQR) | $9,471 | $11,474 |
| Standard Deviation (Sample) | $5,481 | $7,882 |
| Standard Deviation (Population) | $5,370 | $7,805 |
Similar Demographics by Median Earnings
Demographics Similar to Yakama by Median Earnings
In terms of median earnings, the demographic groups most similar to Yakama are Immigrants from Mexico ($39,114, a difference of 0.020%), Immigrants from Congo ($39,169, a difference of 0.16%), Kiowa ($39,232, a difference of 0.32%), Houma ($38,949, a difference of 0.41%), and Spanish American Indian ($38,907, a difference of 0.52%).
| Demographics | Rating | Rank | Median Earnings |
| Creek | 0.0 /100 | #325 | Tragic $39,648 |
| Immigrants | Yemen | 0.0 /100 | #326 | Tragic $39,540 |
| Yuman | 0.0 /100 | #327 | Tragic $39,523 |
| Sioux | 0.0 /100 | #328 | Tragic $39,448 |
| Kiowa | 0.0 /100 | #329 | Tragic $39,232 |
| Immigrants | Congo | 0.0 /100 | #330 | Tragic $39,169 |
| Immigrants | Mexico | 0.0 /100 | #331 | Tragic $39,114 |
| Yakama | 0.0 /100 | #332 | Tragic $39,107 |
| Houma | 0.0 /100 | #333 | Tragic $38,949 |
| Spanish American Indians | 0.0 /100 | #334 | Tragic $38,907 |
| Natives/Alaskans | 0.0 /100 | #335 | Tragic $38,896 |
| Crow | 0.0 /100 | #336 | Tragic $38,707 |
| Immigrants | Cuba | 0.0 /100 | #337 | Tragic $38,426 |
| Pima | 0.0 /100 | #338 | Tragic $38,285 |
| Menominee | 0.0 /100 | #339 | Tragic $37,884 |
Demographics Similar to Immigrants from Eastern Europe by Median Earnings
In terms of median earnings, the demographic groups most similar to Immigrants from Eastern Europe are Immigrants from Bolivia ($51,605, a difference of 0.040%), Immigrants from Croatia ($51,581, a difference of 0.080%), Immigrants from Pakistan ($51,693, a difference of 0.13%), Immigrants from Serbia ($51,557, a difference of 0.13%), and Immigrants from Latvia ($51,555, a difference of 0.13%).
| Demographics | Rating | Rank | Median Earnings |
| Immigrants | South Africa | 100.0 /100 | #50 | Exceptional $51,850 |
| Immigrants | Austria | 99.9 /100 | #51 | Exceptional $51,826 |
| Estonians | 99.9 /100 | #52 | Exceptional $51,772 |
| Immigrants | Norway | 99.9 /100 | #53 | Exceptional $51,758 |
| Immigrants | Indonesia | 99.9 /100 | #54 | Exceptional $51,715 |
| Egyptians | 99.9 /100 | #55 | Exceptional $51,701 |
| Immigrants | Pakistan | 99.9 /100 | #56 | Exceptional $51,693 |
| Immigrants | Eastern Europe | 99.9 /100 | #57 | Exceptional $51,624 |
| Immigrants | Bolivia | 99.9 /100 | #58 | Exceptional $51,605 |
| Immigrants | Croatia | 99.9 /100 | #59 | Exceptional $51,581 |
| Immigrants | Serbia | 99.9 /100 | #60 | Exceptional $51,557 |
| Immigrants | Latvia | 99.9 /100 | #61 | Exceptional $51,555 |
| Immigrants | Romania | 99.9 /100 | #62 | Exceptional $51,337 |
| Immigrants | Bulgaria | 99.9 /100 | #63 | Exceptional $51,318 |
| New Zealanders | 99.9 /100 | #64 | Exceptional $51,246 |