Welsh vs Samoan Per Capita Income
COMPARE
Welsh
Samoan
Per Capita Income
Per Capita Income Comparison
Welsh
Samoans
$43,233
PER CAPITA INCOME
38.2/ 100
METRIC RATING
181st/ 347
METRIC RANK
$39,826
PER CAPITA INCOME
1.3/ 100
METRIC RATING
251st/ 347
METRIC RANK
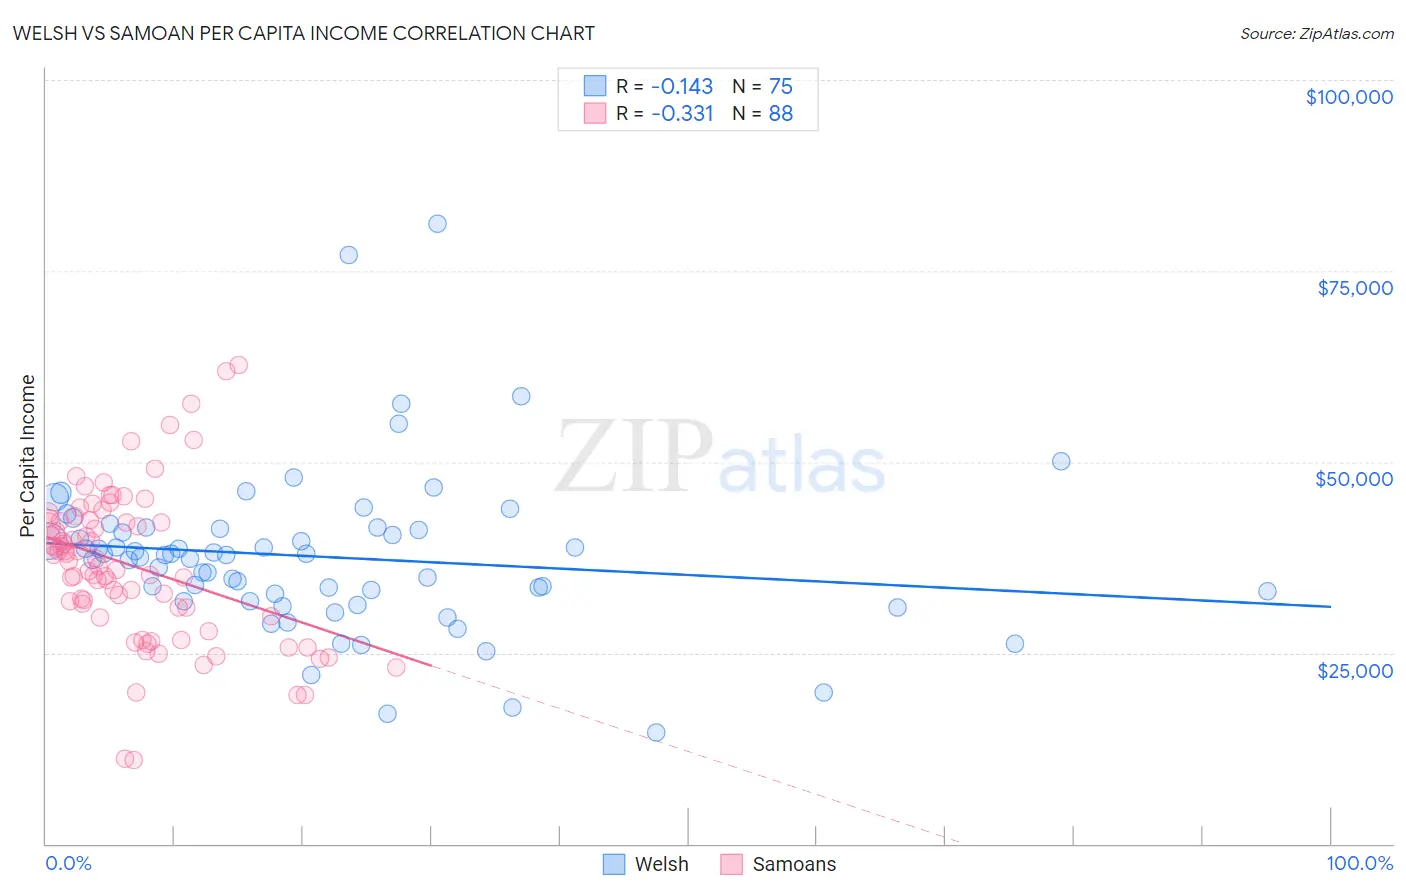
Welsh vs Samoan Per Capita Income Correlation Chart
The statistical analysis conducted on geographies consisting of 528,640,565 people shows a poor negative correlation between the proportion of Welsh and per capita income in the United States with a correlation coefficient (R) of -0.143 and weighted average of $43,233. Similarly, the statistical analysis conducted on geographies consisting of 225,205,450 people shows a mild negative correlation between the proportion of Samoans and per capita income in the United States with a correlation coefficient (R) of -0.331 and weighted average of $39,826, a difference of 8.6%.
Per Capita Income Correlation Summary
| Measurement | Welsh | Samoan |
| Minimum | $14,496 | $10,974 |
| Maximum | $81,151 | $62,755 |
| Range | $66,655 | $51,781 |
| Mean | $37,545 | $36,431 |
| Median | $37,753 | $37,144 |
| Interquartile 25% (IQ1) | $31,788 | $30,385 |
| Interquartile 75% (IQ3) | $41,266 | $42,312 |
| Interquartile Range (IQR) | $9,478 | $11,926 |
| Standard Deviation (Sample) | $10,767 | $9,882 |
| Standard Deviation (Population) | $10,695 | $9,825 |
Similar Demographics by Per Capita Income
Demographics Similar to Welsh by Per Capita Income
In terms of per capita income, the demographic groups most similar to Welsh are Immigrants from Vietnam ($43,229, a difference of 0.010%), German ($43,067, a difference of 0.38%), Sierra Leonean ($43,405, a difference of 0.40%), Spaniard ($43,028, a difference of 0.48%), and Immigrants ($43,010, a difference of 0.52%).
| Demographics | Rating | Rank | Per Capita Income |
| Colombians | 50.0 /100 | #174 | Average $43,661 |
| Celtics | 48.9 /100 | #175 | Average $43,621 |
| Immigrants | South Eastern Asia | 46.6 /100 | #176 | Average $43,539 |
| Tlingit-Haida | 45.9 /100 | #177 | Average $43,516 |
| Immigrants | Costa Rica | 44.5 /100 | #178 | Average $43,464 |
| Finns | 44.4 /100 | #179 | Average $43,461 |
| Sierra Leoneans | 42.9 /100 | #180 | Average $43,405 |
| Welsh | 38.2 /100 | #181 | Fair $43,233 |
| Immigrants | Vietnam | 38.1 /100 | #182 | Fair $43,229 |
| Germans | 33.9 /100 | #183 | Fair $43,067 |
| Spaniards | 32.9 /100 | #184 | Fair $43,028 |
| Immigrants | Immigrants | 32.5 /100 | #185 | Fair $43,010 |
| French Canadians | 32.3 /100 | #186 | Fair $43,003 |
| Immigrants | Colombia | 31.5 /100 | #187 | Fair $42,971 |
| Immigrants | Africa | 31.0 /100 | #188 | Fair $42,950 |
Demographics Similar to Samoans by Per Capita Income
In terms of per capita income, the demographic groups most similar to Samoans are Immigrants from Burma/Myanmar ($39,827, a difference of 0.0%), Japanese ($39,870, a difference of 0.11%), Cape Verdean ($39,935, a difference of 0.27%), Immigrants from Somalia ($39,974, a difference of 0.37%), and Immigrants from the Azores ($39,608, a difference of 0.55%).
| Demographics | Rating | Rank | Per Capita Income |
| French American Indians | 2.1 /100 | #244 | Tragic $40,244 |
| Sub-Saharan Africans | 1.9 /100 | #245 | Tragic $40,152 |
| Cree | 1.7 /100 | #246 | Tragic $40,056 |
| Immigrants | Somalia | 1.6 /100 | #247 | Tragic $39,974 |
| Cape Verdeans | 1.5 /100 | #248 | Tragic $39,935 |
| Japanese | 1.4 /100 | #249 | Tragic $39,870 |
| Immigrants | Burma/Myanmar | 1.3 /100 | #250 | Tragic $39,827 |
| Samoans | 1.3 /100 | #251 | Tragic $39,826 |
| Immigrants | Azores | 1.0 /100 | #252 | Tragic $39,608 |
| Osage | 1.0 /100 | #253 | Tragic $39,568 |
| Alaska Natives | 1.0 /100 | #254 | Tragic $39,558 |
| Immigrants | Middle Africa | 1.0 /100 | #255 | Tragic $39,529 |
| Hawaiians | 0.8 /100 | #256 | Tragic $39,403 |
| Nicaraguans | 0.8 /100 | #257 | Tragic $39,372 |
| Jamaicans | 0.7 /100 | #258 | Tragic $39,231 |