Welsh vs Immigrants from Ghana Householder Income Ages 25 - 44 years
COMPARE
Welsh
Immigrants from Ghana
Householder Income Ages 25 - 44 years
Householder Income Ages 25 - 44 years Comparison
Welsh
Immigrants from Ghana
$93,039
HOUSEHOLDER INCOME AGES 25 - 44 YEARS
30.0/ 100
METRIC RATING
190th/ 347
METRIC RANK
$87,760
HOUSEHOLDER INCOME AGES 25 - 44 YEARS
2.2/ 100
METRIC RATING
239th/ 347
METRIC RANK
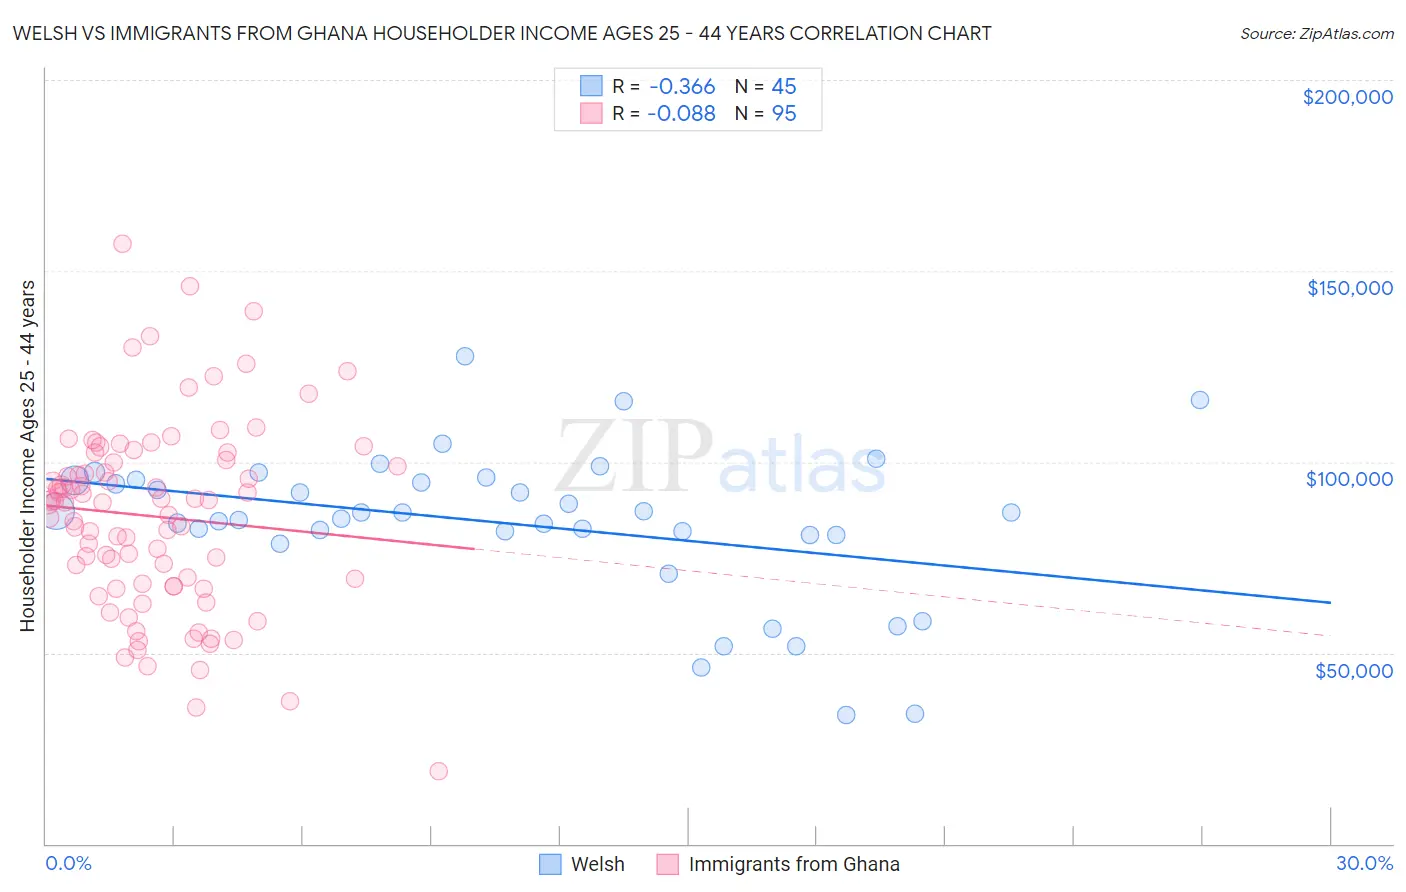
Welsh vs Immigrants from Ghana Householder Income Ages 25 - 44 years Correlation Chart
The statistical analysis conducted on geographies consisting of 524,969,019 people shows a mild negative correlation between the proportion of Welsh and household income with householder between the ages 25 and 44 in the United States with a correlation coefficient (R) of -0.366 and weighted average of $93,039. Similarly, the statistical analysis conducted on geographies consisting of 199,650,351 people shows a slight negative correlation between the proportion of Immigrants from Ghana and household income with householder between the ages 25 and 44 in the United States with a correlation coefficient (R) of -0.088 and weighted average of $87,760, a difference of 6.0%.
Householder Income Ages 25 - 44 years Correlation Summary
| Measurement | Welsh | Immigrants from Ghana |
| Minimum | $33,750 | $18,980 |
| Maximum | $127,625 | $157,070 |
| Range | $93,875 | $138,090 |
| Mean | $83,695 | $85,645 |
| Median | $86,585 | $89,488 |
| Interquartile 25% (IQ1) | $80,749 | $67,346 |
| Interquartile 75% (IQ3) | $95,164 | $100,333 |
| Interquartile Range (IQR) | $14,415 | $32,987 |
| Standard Deviation (Sample) | $19,829 | $24,889 |
| Standard Deviation (Population) | $19,607 | $24,757 |
Similar Demographics by Householder Income Ages 25 - 44 years
Demographics Similar to Welsh by Householder Income Ages 25 - 44 years
In terms of householder income ages 25 - 44 years, the demographic groups most similar to Welsh are Dutch ($93,081, a difference of 0.040%), Tlingit-Haida ($92,987, a difference of 0.060%), Immigrants from Sierra Leone ($93,115, a difference of 0.080%), Immigrants from Costa Rica ($92,876, a difference of 0.18%), and Spaniard ($93,366, a difference of 0.35%).
| Demographics | Rating | Rank | Householder Income Ages 25 - 44 years |
| Guamanians/Chamorros | 36.5 /100 | #183 | Fair $93,569 |
| Germans | 36.0 /100 | #184 | Fair $93,531 |
| Immigrants | Eritrea | 35.2 /100 | #185 | Fair $93,466 |
| Sierra Leoneans | 34.8 /100 | #186 | Fair $93,435 |
| Spaniards | 34.0 /100 | #187 | Fair $93,366 |
| Immigrants | Sierra Leone | 30.9 /100 | #188 | Fair $93,115 |
| Dutch | 30.5 /100 | #189 | Fair $93,081 |
| Welsh | 30.0 /100 | #190 | Fair $93,039 |
| Tlingit-Haida | 29.4 /100 | #191 | Fair $92,987 |
| Immigrants | Costa Rica | 28.2 /100 | #192 | Fair $92,876 |
| Samoans | 23.0 /100 | #193 | Fair $92,385 |
| Immigrants | Azores | 22.4 /100 | #194 | Fair $92,322 |
| Celtics | 21.6 /100 | #195 | Fair $92,241 |
| Immigrants | Colombia | 21.3 /100 | #196 | Fair $92,204 |
| Spanish | 21.2 /100 | #197 | Fair $92,200 |
Demographics Similar to Immigrants from Ghana by Householder Income Ages 25 - 44 years
In terms of householder income ages 25 - 44 years, the demographic groups most similar to Immigrants from Ghana are Nicaraguan ($87,751, a difference of 0.010%), Nigerian ($87,730, a difference of 0.030%), Alaska Native ($88,018, a difference of 0.29%), Salvadoran ($88,198, a difference of 0.50%), and Immigrants from Cameroon ($88,214, a difference of 0.52%).
| Demographics | Rating | Rank | Householder Income Ages 25 - 44 years |
| Immigrants | Nonimmigrants | 3.0 /100 | #232 | Tragic $88,301 |
| Malaysians | 3.0 /100 | #233 | Tragic $88,291 |
| Venezuelans | 2.9 /100 | #234 | Tragic $88,232 |
| Bermudans | 2.9 /100 | #235 | Tragic $88,231 |
| Immigrants | Cameroon | 2.9 /100 | #236 | Tragic $88,214 |
| Salvadorans | 2.8 /100 | #237 | Tragic $88,198 |
| Alaska Natives | 2.6 /100 | #238 | Tragic $88,018 |
| Immigrants | Ghana | 2.2 /100 | #239 | Tragic $87,760 |
| Nicaraguans | 2.2 /100 | #240 | Tragic $87,751 |
| Nigerians | 2.2 /100 | #241 | Tragic $87,730 |
| West Indians | 1.7 /100 | #242 | Tragic $87,205 |
| Immigrants | West Indies | 1.5 /100 | #243 | Tragic $87,063 |
| Immigrants | Venezuela | 1.5 /100 | #244 | Tragic $87,038 |
| Immigrants | El Salvador | 1.4 /100 | #245 | Tragic $86,913 |
| Immigrants | Burma/Myanmar | 1.3 /100 | #246 | Tragic $86,736 |