Welsh vs Immigrants from Central America Householder Income Ages 25 - 44 years
COMPARE
Welsh
Immigrants from Central America
Householder Income Ages 25 - 44 years
Householder Income Ages 25 - 44 years Comparison
Welsh
Immigrants from Central America
$93,039
HOUSEHOLDER INCOME AGES 25 - 44 YEARS
30.0/ 100
METRIC RATING
190th/ 347
METRIC RANK
$80,012
HOUSEHOLDER INCOME AGES 25 - 44 YEARS
0.0/ 100
METRIC RATING
308th/ 347
METRIC RANK
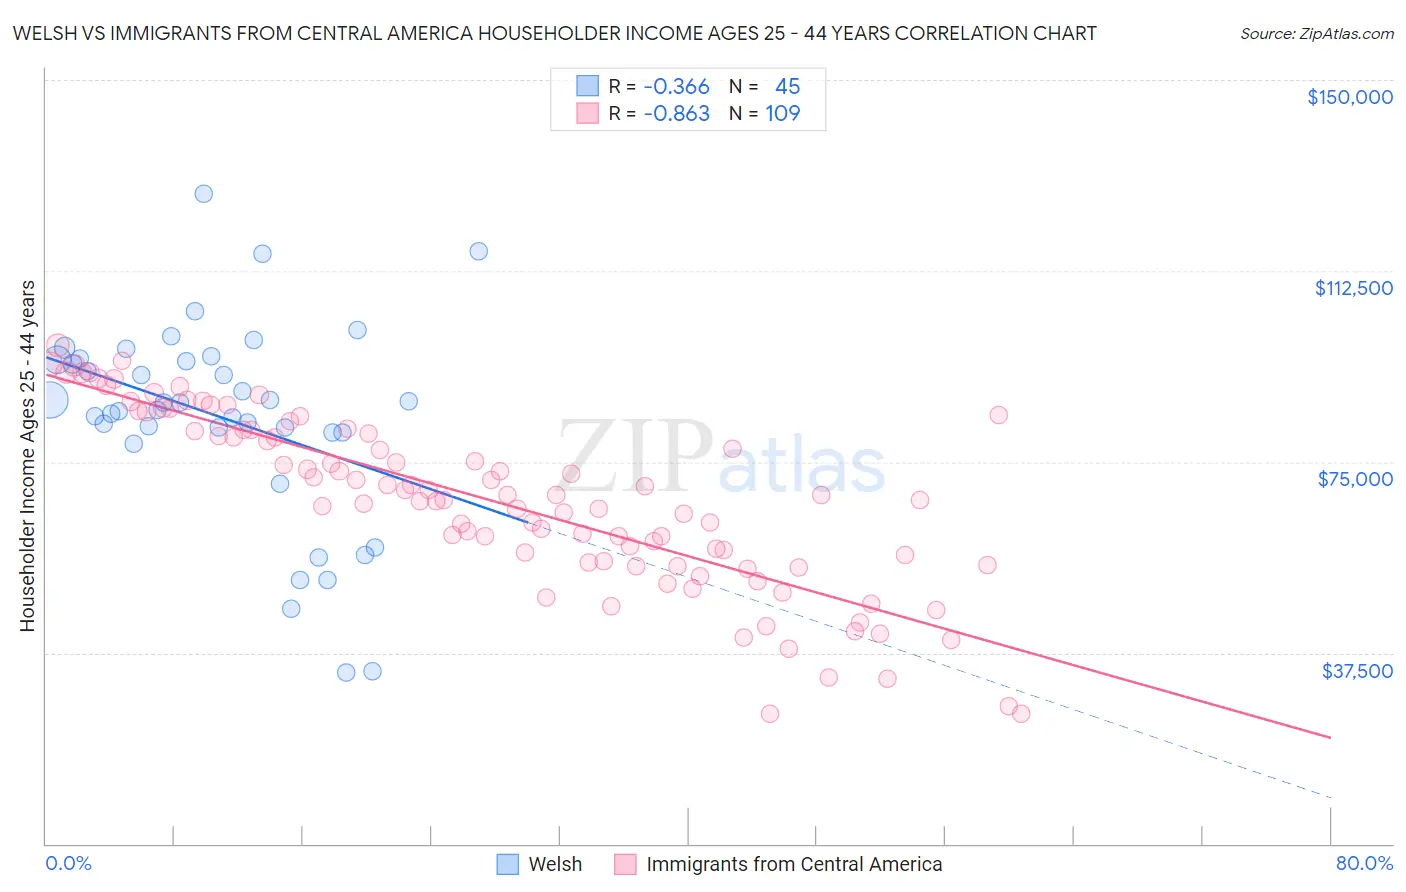
Welsh vs Immigrants from Central America Householder Income Ages 25 - 44 years Correlation Chart
The statistical analysis conducted on geographies consisting of 524,969,019 people shows a mild negative correlation between the proportion of Welsh and household income with householder between the ages 25 and 44 in the United States with a correlation coefficient (R) of -0.366 and weighted average of $93,039. Similarly, the statistical analysis conducted on geographies consisting of 532,829,838 people shows a very strong negative correlation between the proportion of Immigrants from Central America and household income with householder between the ages 25 and 44 in the United States with a correlation coefficient (R) of -0.863 and weighted average of $80,012, a difference of 16.3%.
Householder Income Ages 25 - 44 years Correlation Summary
| Measurement | Welsh | Immigrants from Central America |
| Minimum | $33,750 | $25,500 |
| Maximum | $127,625 | $97,900 |
| Range | $93,875 | $72,400 |
| Mean | $83,695 | $67,406 |
| Median | $86,585 | $68,457 |
| Interquartile 25% (IQ1) | $80,749 | $55,448 |
| Interquartile 75% (IQ3) | $95,164 | $81,287 |
| Interquartile Range (IQR) | $14,415 | $25,840 |
| Standard Deviation (Sample) | $19,829 | $17,129 |
| Standard Deviation (Population) | $19,607 | $17,050 |
Similar Demographics by Householder Income Ages 25 - 44 years
Demographics Similar to Welsh by Householder Income Ages 25 - 44 years
In terms of householder income ages 25 - 44 years, the demographic groups most similar to Welsh are Dutch ($93,081, a difference of 0.040%), Tlingit-Haida ($92,987, a difference of 0.060%), Immigrants from Sierra Leone ($93,115, a difference of 0.080%), Immigrants from Costa Rica ($92,876, a difference of 0.18%), and Spaniard ($93,366, a difference of 0.35%).
| Demographics | Rating | Rank | Householder Income Ages 25 - 44 years |
| Guamanians/Chamorros | 36.5 /100 | #183 | Fair $93,569 |
| Germans | 36.0 /100 | #184 | Fair $93,531 |
| Immigrants | Eritrea | 35.2 /100 | #185 | Fair $93,466 |
| Sierra Leoneans | 34.8 /100 | #186 | Fair $93,435 |
| Spaniards | 34.0 /100 | #187 | Fair $93,366 |
| Immigrants | Sierra Leone | 30.9 /100 | #188 | Fair $93,115 |
| Dutch | 30.5 /100 | #189 | Fair $93,081 |
| Welsh | 30.0 /100 | #190 | Fair $93,039 |
| Tlingit-Haida | 29.4 /100 | #191 | Fair $92,987 |
| Immigrants | Costa Rica | 28.2 /100 | #192 | Fair $92,876 |
| Samoans | 23.0 /100 | #193 | Fair $92,385 |
| Immigrants | Azores | 22.4 /100 | #194 | Fair $92,322 |
| Celtics | 21.6 /100 | #195 | Fair $92,241 |
| Immigrants | Colombia | 21.3 /100 | #196 | Fair $92,204 |
| Spanish | 21.2 /100 | #197 | Fair $92,200 |
Demographics Similar to Immigrants from Central America by Householder Income Ages 25 - 44 years
In terms of householder income ages 25 - 44 years, the demographic groups most similar to Immigrants from Central America are Chippewa ($80,005, a difference of 0.010%), Haitian ($80,055, a difference of 0.050%), Fijian ($79,956, a difference of 0.070%), Apache ($80,260, a difference of 0.31%), and Immigrants from Dominican Republic ($80,319, a difference of 0.38%).
| Demographics | Rating | Rank | Householder Income Ages 25 - 44 years |
| Immigrants | Micronesia | 0.0 /100 | #301 | Tragic $80,544 |
| Hispanics or Latinos | 0.0 /100 | #302 | Tragic $80,515 |
| Mexicans | 0.0 /100 | #303 | Tragic $80,427 |
| Immigrants | Caribbean | 0.0 /100 | #304 | Tragic $80,326 |
| Immigrants | Dominican Republic | 0.0 /100 | #305 | Tragic $80,319 |
| Apache | 0.0 /100 | #306 | Tragic $80,260 |
| Haitians | 0.0 /100 | #307 | Tragic $80,055 |
| Immigrants | Central America | 0.0 /100 | #308 | Tragic $80,012 |
| Chippewa | 0.0 /100 | #309 | Tragic $80,005 |
| Fijians | 0.0 /100 | #310 | Tragic $79,956 |
| Indonesians | 0.0 /100 | #311 | Tragic $79,543 |
| Immigrants | Haiti | 0.0 /100 | #312 | Tragic $79,391 |
| Menominee | 0.0 /100 | #313 | Tragic $79,358 |
| Cheyenne | 0.0 /100 | #314 | Tragic $79,152 |
| Ottawa | 0.0 /100 | #315 | Tragic $79,012 |