Welsh vs Aleut 8th Grade
COMPARE
Welsh
Aleut
8th Grade
8th Grade Comparison
Welsh
Aleuts
97.2%
8TH GRADE
100.0/ 100
METRIC RATING
22nd/ 347
METRIC RANK
96.9%
8TH GRADE
99.9/ 100
METRIC RATING
43rd/ 347
METRIC RANK
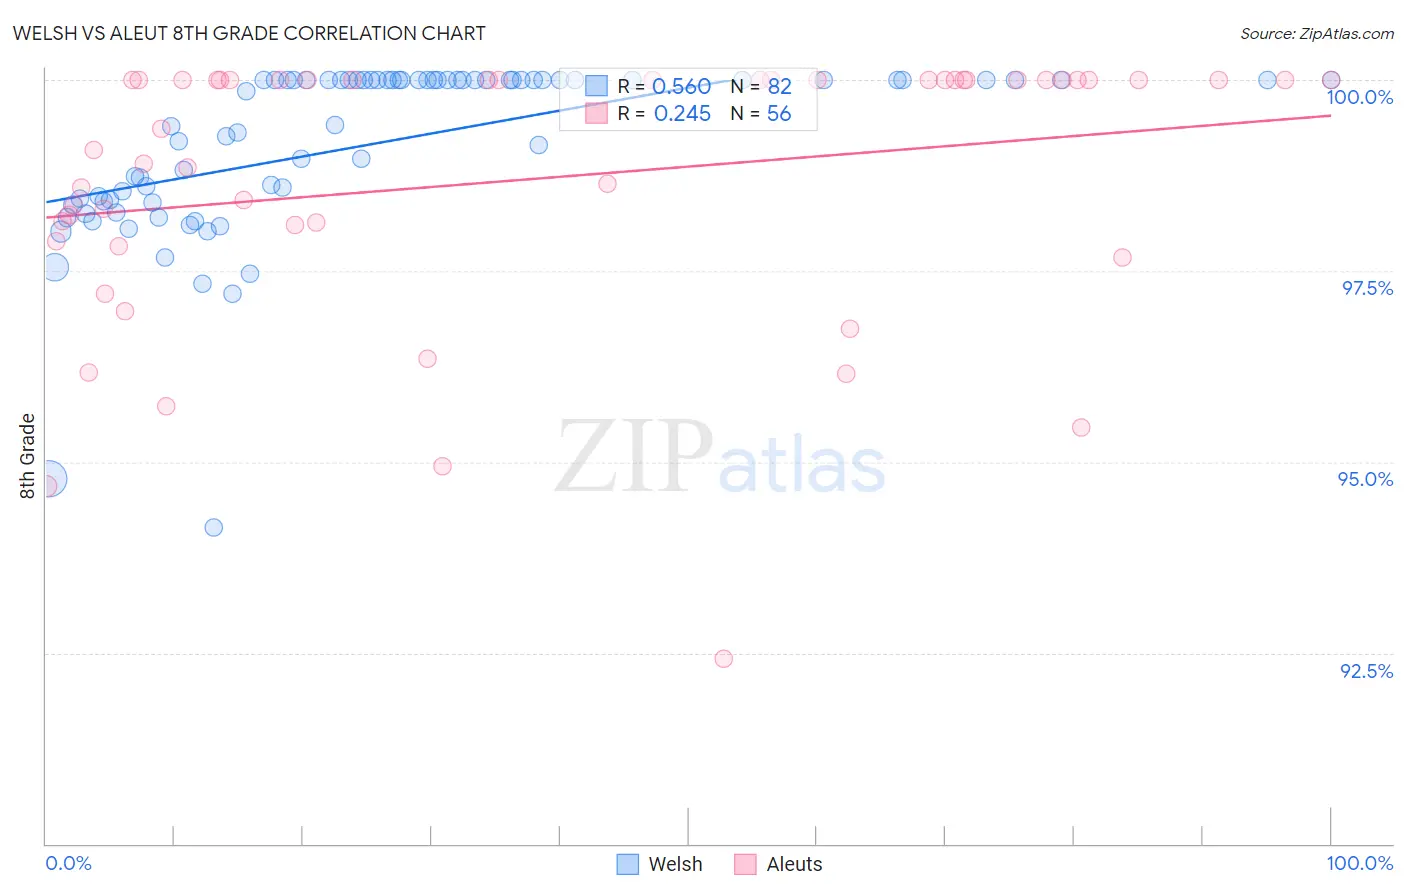
Welsh vs Aleut 8th Grade Correlation Chart
The statistical analysis conducted on geographies consisting of 528,593,877 people shows a substantial positive correlation between the proportion of Welsh and percentage of population with at least 8th grade education in the United States with a correlation coefficient (R) of 0.560 and weighted average of 97.2%. Similarly, the statistical analysis conducted on geographies consisting of 61,780,964 people shows a weak positive correlation between the proportion of Aleuts and percentage of population with at least 8th grade education in the United States with a correlation coefficient (R) of 0.245 and weighted average of 96.9%, a difference of 0.29%.
8th Grade Correlation Summary
| Measurement | Welsh | Aleut |
| Minimum | 94.1% | 92.4% |
| Maximum | 100.0% | 100.0% |
| Range | 5.9% | 7.6% |
| Mean | 99.2% | 98.7% |
| Median | 100.0% | 100.0% |
| Interquartile 25% (IQ1) | 98.4% | 98.0% |
| Interquartile 75% (IQ3) | 100.0% | 100.0% |
| Interquartile Range (IQR) | 1.6% | 2.0% |
| Standard Deviation (Sample) | 1.1% | 1.8% |
| Standard Deviation (Population) | 1.1% | 1.7% |
Similar Demographics by 8th Grade
Demographics Similar to Welsh by 8th Grade
In terms of 8th grade, the demographic groups most similar to Welsh are French Canadian (97.2%, a difference of 0.010%), Scandinavian (97.2%, a difference of 0.010%), Czech (97.1%, a difference of 0.020%), Danish (97.2%, a difference of 0.030%), and French (97.1%, a difference of 0.030%).
| Demographics | Rating | Rank | 8th Grade |
| Pennsylvania Germans | 100.0 /100 | #15 | Exceptional 97.3% |
| Tlingit-Haida | 100.0 /100 | #16 | Exceptional 97.3% |
| Irish | 100.0 /100 | #17 | Exceptional 97.3% |
| Lithuanians | 100.0 /100 | #18 | Exceptional 97.3% |
| Scottish | 100.0 /100 | #19 | Exceptional 97.3% |
| Croatians | 100.0 /100 | #20 | Exceptional 97.2% |
| Danes | 100.0 /100 | #21 | Exceptional 97.2% |
| Welsh | 100.0 /100 | #22 | Exceptional 97.2% |
| French Canadians | 100.0 /100 | #23 | Exceptional 97.2% |
| Scandinavians | 100.0 /100 | #24 | Exceptional 97.2% |
| Czechs | 100.0 /100 | #25 | Exceptional 97.1% |
| French | 100.0 /100 | #26 | Exceptional 97.1% |
| Scotch-Irish | 100.0 /100 | #27 | Exceptional 97.1% |
| Italians | 100.0 /100 | #28 | Exceptional 97.1% |
| Europeans | 100.0 /100 | #29 | Exceptional 97.1% |
Demographics Similar to Aleuts by 8th Grade
In terms of 8th grade, the demographic groups most similar to Aleuts are Maltese (96.9%, a difference of 0.020%), Northern European (96.9%, a difference of 0.020%), Chinese (96.9%, a difference of 0.030%), Czechoslovakian (96.9%, a difference of 0.030%), and Bulgarian (96.9%, a difference of 0.040%).
| Demographics | Rating | Rank | 8th Grade |
| Belgians | 100.0 /100 | #36 | Exceptional 97.0% |
| Latvians | 100.0 /100 | #37 | Exceptional 97.0% |
| British | 100.0 /100 | #38 | Exceptional 97.0% |
| Hungarians | 100.0 /100 | #39 | Exceptional 97.0% |
| Inupiat | 100.0 /100 | #40 | Exceptional 97.0% |
| Eastern Europeans | 100.0 /100 | #41 | Exceptional 97.0% |
| Chinese | 100.0 /100 | #42 | Exceptional 96.9% |
| Aleuts | 99.9 /100 | #43 | Exceptional 96.9% |
| Maltese | 99.9 /100 | #44 | Exceptional 96.9% |
| Northern Europeans | 99.9 /100 | #45 | Exceptional 96.9% |
| Czechoslovakians | 99.9 /100 | #46 | Exceptional 96.9% |
| Bulgarians | 99.9 /100 | #47 | Exceptional 96.9% |
| Slavs | 99.9 /100 | #48 | Exceptional 96.8% |
| Estonians | 99.9 /100 | #49 | Exceptional 96.8% |
| Immigrants | Scotland | 99.9 /100 | #50 | Exceptional 96.8% |