Vietnamese vs Senegalese Median Family Income
COMPARE
Vietnamese
Senegalese
Median Family Income
Median Family Income Comparison
Vietnamese
Senegalese
$96,123
MEDIAN FAMILY INCOME
3.4/ 100
METRIC RATING
225th/ 347
METRIC RANK
$91,475
MEDIAN FAMILY INCOME
0.3/ 100
METRIC RATING
264th/ 347
METRIC RANK
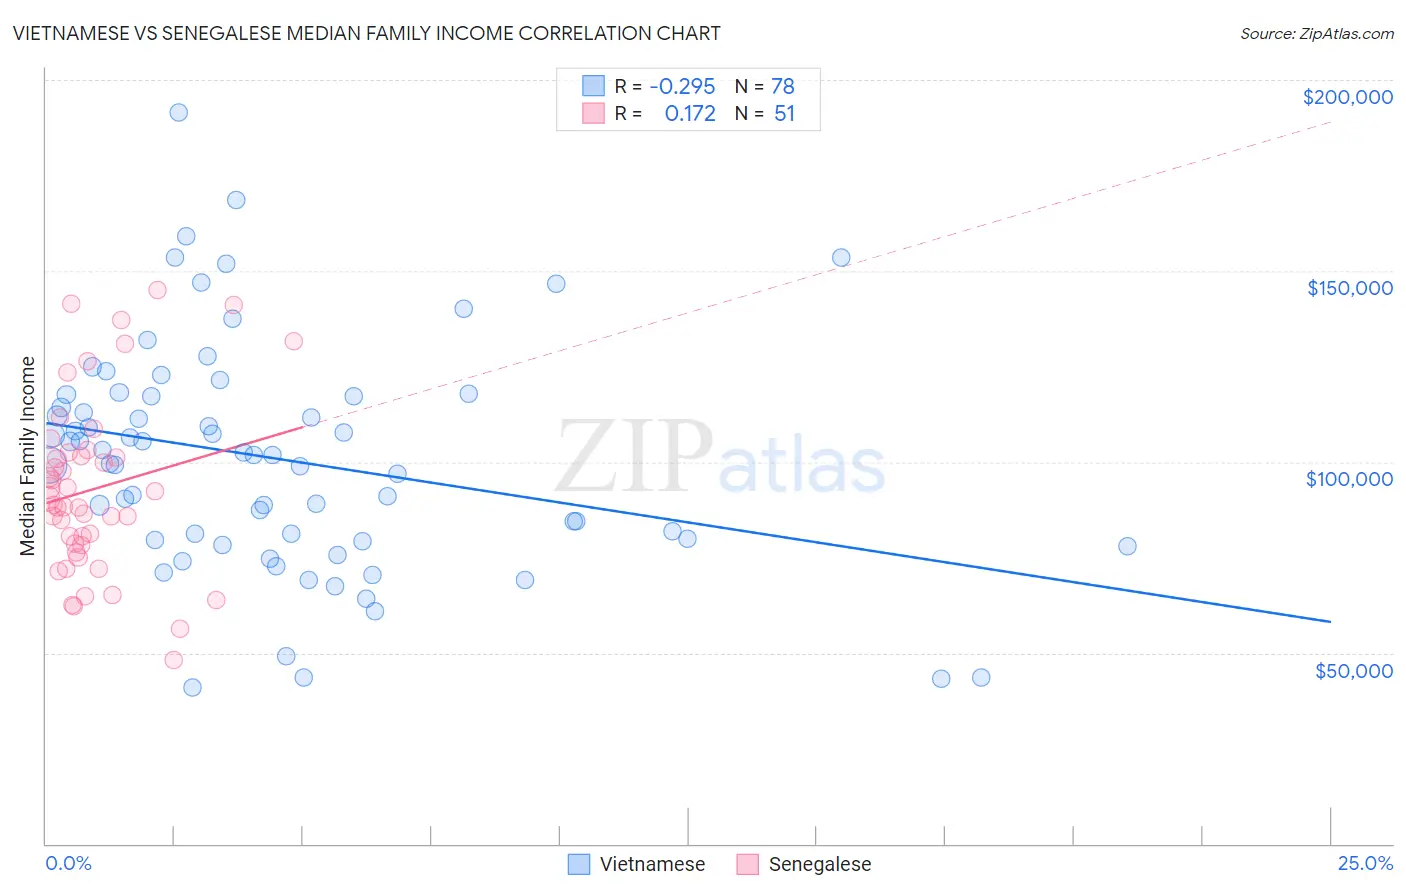
Vietnamese vs Senegalese Median Family Income Correlation Chart
The statistical analysis conducted on geographies consisting of 170,610,316 people shows a weak negative correlation between the proportion of Vietnamese and median family income in the United States with a correlation coefficient (R) of -0.295 and weighted average of $96,123. Similarly, the statistical analysis conducted on geographies consisting of 78,068,441 people shows a poor positive correlation between the proportion of Senegalese and median family income in the United States with a correlation coefficient (R) of 0.172 and weighted average of $91,475, a difference of 5.1%.
Median Family Income Correlation Summary
| Measurement | Vietnamese | Senegalese |
| Minimum | $40,807 | $48,125 |
| Maximum | $191,643 | $145,000 |
| Range | $150,837 | $96,875 |
| Mean | $100,636 | $92,900 |
| Median | $101,824 | $88,669 |
| Interquartile 25% (IQ1) | $79,608 | $78,308 |
| Interquartile 75% (IQ3) | $117,250 | $102,554 |
| Interquartile Range (IQR) | $37,642 | $24,246 |
| Standard Deviation (Sample) | $30,077 | $22,975 |
| Standard Deviation (Population) | $29,884 | $22,749 |
Similar Demographics by Median Family Income
Demographics Similar to Vietnamese by Median Family Income
In terms of median family income, the demographic groups most similar to Vietnamese are Nonimmigrants ($96,231, a difference of 0.11%), Venezuelan ($96,281, a difference of 0.16%), Immigrants from Nigeria ($96,439, a difference of 0.33%), Immigrants from Ghana ($96,544, a difference of 0.44%), and Immigrants from Panama ($95,647, a difference of 0.50%).
| Demographics | Rating | Rank | Median Family Income |
| Immigrants | Cambodia | 5.8 /100 | #218 | Tragic $97,222 |
| Delaware | 5.1 /100 | #219 | Tragic $96,958 |
| Sudanese | 4.7 /100 | #220 | Tragic $96,783 |
| Immigrants | Ghana | 4.2 /100 | #221 | Tragic $96,544 |
| Immigrants | Nigeria | 4.0 /100 | #222 | Tragic $96,439 |
| Venezuelans | 3.7 /100 | #223 | Tragic $96,281 |
| Immigrants | Nonimmigrants | 3.6 /100 | #224 | Tragic $96,231 |
| Vietnamese | 3.4 /100 | #225 | Tragic $96,123 |
| Immigrants | Panama | 2.7 /100 | #226 | Tragic $95,647 |
| Alaska Natives | 2.6 /100 | #227 | Tragic $95,573 |
| Immigrants | Azores | 2.4 /100 | #228 | Tragic $95,402 |
| Marshallese | 2.2 /100 | #229 | Tragic $95,293 |
| Malaysians | 2.2 /100 | #230 | Tragic $95,230 |
| Ecuadorians | 2.1 /100 | #231 | Tragic $95,114 |
| Immigrants | Venezuela | 1.9 /100 | #232 | Tragic $94,904 |
Demographics Similar to Senegalese by Median Family Income
In terms of median family income, the demographic groups most similar to Senegalese are Immigrants from West Indies ($91,588, a difference of 0.12%), Hmong ($91,296, a difference of 0.20%), Liberian ($91,722, a difference of 0.27%), Inupiat ($91,730, a difference of 0.28%), and Pennsylvania German ($91,763, a difference of 0.31%).
| Demographics | Rating | Rank | Median Family Income |
| Americans | 0.4 /100 | #257 | Tragic $92,096 |
| Osage | 0.4 /100 | #258 | Tragic $91,926 |
| Cape Verdeans | 0.4 /100 | #259 | Tragic $91,848 |
| Pennsylvania Germans | 0.4 /100 | #260 | Tragic $91,763 |
| Inupiat | 0.4 /100 | #261 | Tragic $91,730 |
| Liberians | 0.4 /100 | #262 | Tragic $91,722 |
| Immigrants | West Indies | 0.3 /100 | #263 | Tragic $91,588 |
| Senegalese | 0.3 /100 | #264 | Tragic $91,475 |
| Hmong | 0.3 /100 | #265 | Tragic $91,296 |
| Central Americans | 0.3 /100 | #266 | Tragic $91,087 |
| Mexican American Indians | 0.2 /100 | #267 | Tragic $90,918 |
| Cree | 0.2 /100 | #268 | Tragic $90,882 |
| Belizeans | 0.2 /100 | #269 | Tragic $90,880 |
| Jamaicans | 0.2 /100 | #270 | Tragic $90,581 |
| Iroquois | 0.2 /100 | #271 | Tragic $90,543 |