Vietnamese vs Latvian Median Family Income
COMPARE
Vietnamese
Latvian
Median Family Income
Median Family Income Comparison
Vietnamese
Latvians
$96,123
MEDIAN FAMILY INCOME
3.4/ 100
METRIC RATING
225th/ 347
METRIC RANK
$120,301
MEDIAN FAMILY INCOME
100.0/ 100
METRIC RATING
29th/ 347
METRIC RANK
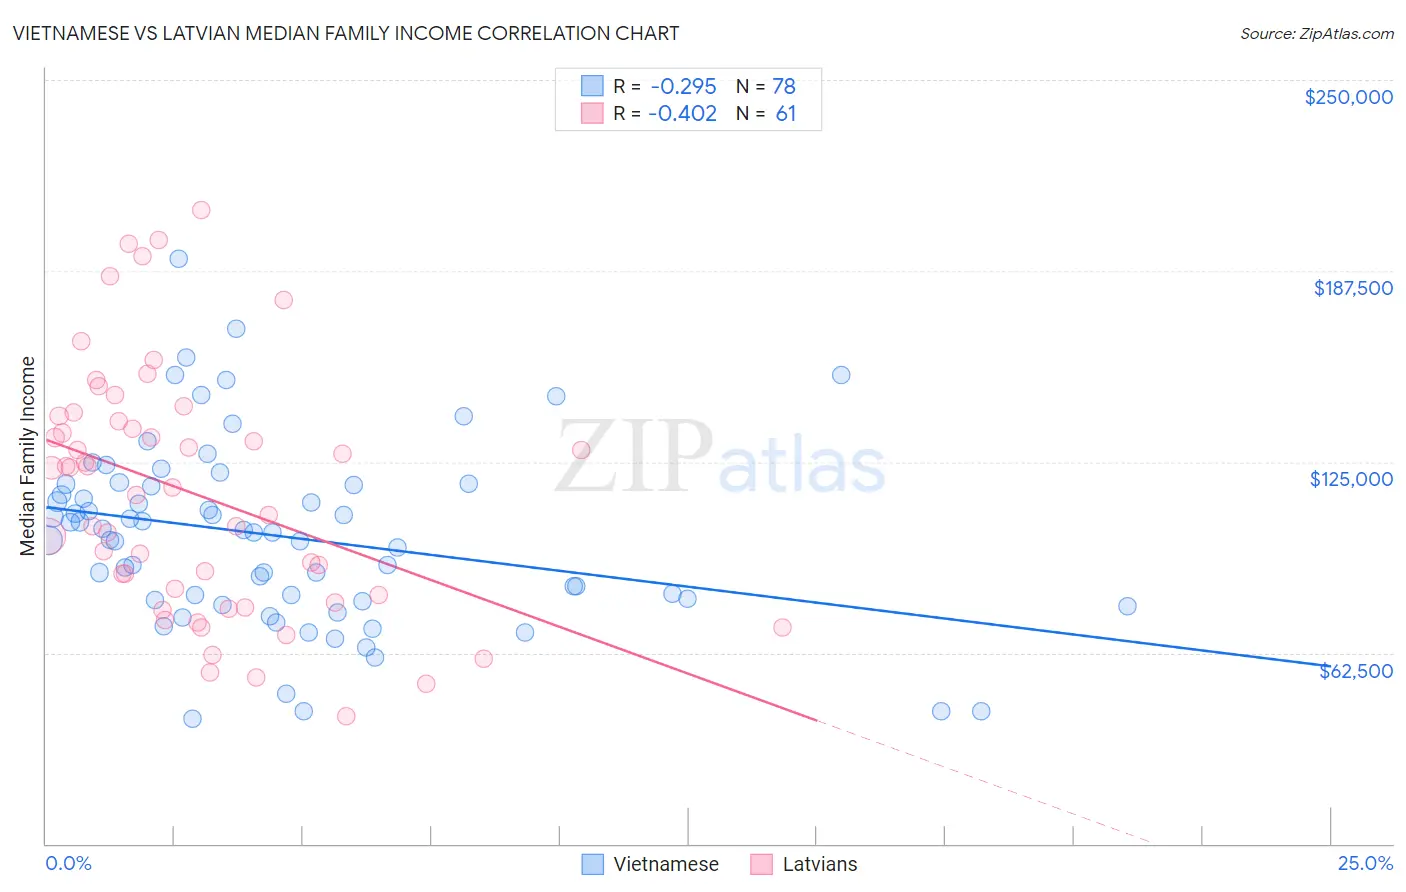
Vietnamese vs Latvian Median Family Income Correlation Chart
The statistical analysis conducted on geographies consisting of 170,610,316 people shows a weak negative correlation between the proportion of Vietnamese and median family income in the United States with a correlation coefficient (R) of -0.295 and weighted average of $96,123. Similarly, the statistical analysis conducted on geographies consisting of 220,626,536 people shows a moderate negative correlation between the proportion of Latvians and median family income in the United States with a correlation coefficient (R) of -0.402 and weighted average of $120,301, a difference of 25.2%.
Median Family Income Correlation Summary
| Measurement | Vietnamese | Latvian |
| Minimum | $40,807 | $41,641 |
| Maximum | $191,643 | $207,328 |
| Range | $150,837 | $165,687 |
| Mean | $100,636 | $114,631 |
| Median | $101,824 | $116,635 |
| Interquartile 25% (IQ1) | $79,608 | $80,254 |
| Interquartile 75% (IQ3) | $117,250 | $139,118 |
| Interquartile Range (IQR) | $37,642 | $58,864 |
| Standard Deviation (Sample) | $30,077 | $40,043 |
| Standard Deviation (Population) | $29,884 | $39,714 |
Similar Demographics by Median Family Income
Demographics Similar to Vietnamese by Median Family Income
In terms of median family income, the demographic groups most similar to Vietnamese are Nonimmigrants ($96,231, a difference of 0.11%), Venezuelan ($96,281, a difference of 0.16%), Immigrants from Nigeria ($96,439, a difference of 0.33%), Immigrants from Ghana ($96,544, a difference of 0.44%), and Immigrants from Panama ($95,647, a difference of 0.50%).
| Demographics | Rating | Rank | Median Family Income |
| Immigrants | Cambodia | 5.8 /100 | #218 | Tragic $97,222 |
| Delaware | 5.1 /100 | #219 | Tragic $96,958 |
| Sudanese | 4.7 /100 | #220 | Tragic $96,783 |
| Immigrants | Ghana | 4.2 /100 | #221 | Tragic $96,544 |
| Immigrants | Nigeria | 4.0 /100 | #222 | Tragic $96,439 |
| Venezuelans | 3.7 /100 | #223 | Tragic $96,281 |
| Immigrants | Nonimmigrants | 3.6 /100 | #224 | Tragic $96,231 |
| Vietnamese | 3.4 /100 | #225 | Tragic $96,123 |
| Immigrants | Panama | 2.7 /100 | #226 | Tragic $95,647 |
| Alaska Natives | 2.6 /100 | #227 | Tragic $95,573 |
| Immigrants | Azores | 2.4 /100 | #228 | Tragic $95,402 |
| Marshallese | 2.2 /100 | #229 | Tragic $95,293 |
| Malaysians | 2.2 /100 | #230 | Tragic $95,230 |
| Ecuadorians | 2.1 /100 | #231 | Tragic $95,114 |
| Immigrants | Venezuela | 1.9 /100 | #232 | Tragic $94,904 |
Demographics Similar to Latvians by Median Family Income
In terms of median family income, the demographic groups most similar to Latvians are Immigrants from Sri Lanka ($120,263, a difference of 0.030%), Immigrants from Denmark ($120,445, a difference of 0.12%), Russian ($120,487, a difference of 0.15%), Immigrants from France ($120,076, a difference of 0.19%), and Asian ($119,955, a difference of 0.29%).
| Demographics | Rating | Rank | Median Family Income |
| Immigrants | Sweden | 100.0 /100 | #22 | Exceptional $122,765 |
| Immigrants | Japan | 100.0 /100 | #23 | Exceptional $122,764 |
| Immigrants | Northern Europe | 100.0 /100 | #24 | Exceptional $121,840 |
| Turks | 100.0 /100 | #25 | Exceptional $121,202 |
| Immigrants | Switzerland | 100.0 /100 | #26 | Exceptional $120,726 |
| Russians | 100.0 /100 | #27 | Exceptional $120,487 |
| Immigrants | Denmark | 100.0 /100 | #28 | Exceptional $120,445 |
| Latvians | 100.0 /100 | #29 | Exceptional $120,301 |
| Immigrants | Sri Lanka | 100.0 /100 | #30 | Exceptional $120,263 |
| Immigrants | France | 100.0 /100 | #31 | Exceptional $120,076 |
| Asians | 100.0 /100 | #32 | Exceptional $119,955 |
| Bhutanese | 100.0 /100 | #33 | Exceptional $119,800 |
| Bolivians | 100.0 /100 | #34 | Exceptional $119,479 |
| Soviet Union | 100.0 /100 | #35 | Exceptional $119,262 |
| Israelis | 100.0 /100 | #36 | Exceptional $118,577 |