Scandinavian vs Latvian Median Family Income
COMPARE
Scandinavian
Latvian
Median Family Income
Median Family Income Comparison
Scandinavians
Latvians
$104,410
MEDIAN FAMILY INCOME
70.8/ 100
METRIC RATING
158th/ 347
METRIC RANK
$120,301
MEDIAN FAMILY INCOME
100.0/ 100
METRIC RATING
29th/ 347
METRIC RANK
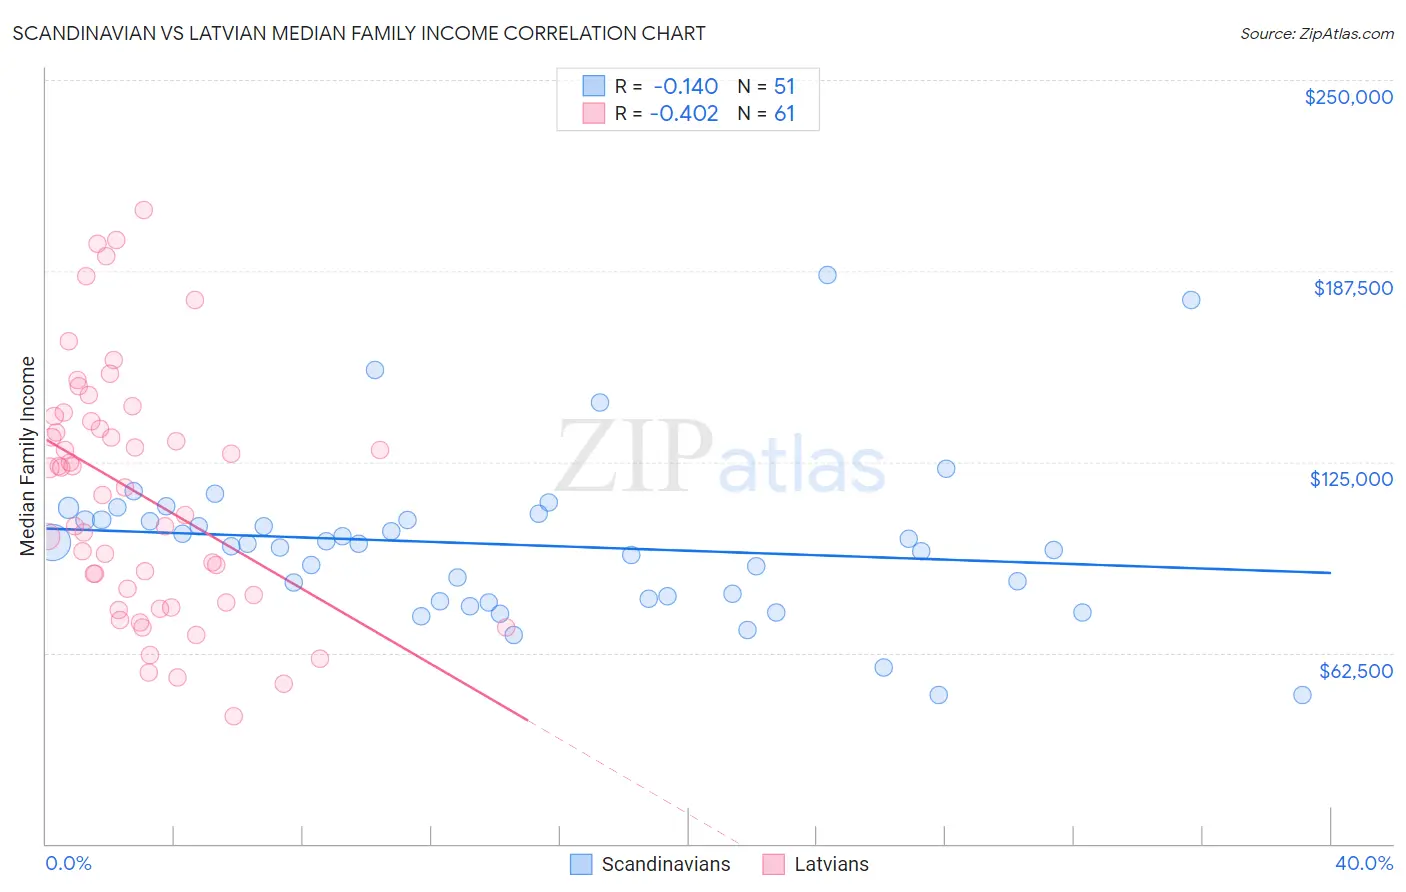
Scandinavian vs Latvian Median Family Income Correlation Chart
The statistical analysis conducted on geographies consisting of 472,034,552 people shows a poor negative correlation between the proportion of Scandinavians and median family income in the United States with a correlation coefficient (R) of -0.140 and weighted average of $104,410. Similarly, the statistical analysis conducted on geographies consisting of 220,626,536 people shows a moderate negative correlation between the proportion of Latvians and median family income in the United States with a correlation coefficient (R) of -0.402 and weighted average of $120,301, a difference of 15.2%.
Median Family Income Correlation Summary
| Measurement | Scandinavian | Latvian |
| Minimum | $48,750 | $41,641 |
| Maximum | $186,250 | $207,328 |
| Range | $137,500 | $165,687 |
| Mean | $97,868 | $114,631 |
| Median | $98,046 | $116,635 |
| Interquartile 25% (IQ1) | $80,113 | $80,254 |
| Interquartile 75% (IQ3) | $106,098 | $139,118 |
| Interquartile Range (IQR) | $25,985 | $58,864 |
| Standard Deviation (Sample) | $26,299 | $40,043 |
| Standard Deviation (Population) | $26,040 | $39,714 |
Similar Demographics by Median Family Income
Demographics Similar to Scandinavians by Median Family Income
In terms of median family income, the demographic groups most similar to Scandinavians are Swiss ($104,396, a difference of 0.010%), Moroccan ($104,488, a difference of 0.080%), Scottish ($104,288, a difference of 0.12%), Icelander ($104,282, a difference of 0.12%), and Basque ($104,760, a difference of 0.34%).
| Demographics | Rating | Rank | Median Family Income |
| Peruvians | 80.4 /100 | #151 | Excellent $105,444 |
| Immigrants | Albania | 79.1 /100 | #152 | Good $105,285 |
| Slavs | 77.9 /100 | #153 | Good $105,144 |
| Immigrants | Nepal | 76.3 /100 | #154 | Good $104,966 |
| Native Hawaiians | 75.8 /100 | #155 | Good $104,910 |
| Basques | 74.4 /100 | #156 | Good $104,760 |
| Moroccans | 71.6 /100 | #157 | Good $104,488 |
| Scandinavians | 70.8 /100 | #158 | Good $104,410 |
| Swiss | 70.7 /100 | #159 | Good $104,396 |
| Scottish | 69.5 /100 | #160 | Good $104,288 |
| Icelanders | 69.4 /100 | #161 | Good $104,282 |
| Immigrants | Sierra Leone | 66.2 /100 | #162 | Good $103,990 |
| Costa Ricans | 66.2 /100 | #163 | Good $103,989 |
| Sierra Leoneans | 64.7 /100 | #164 | Good $103,859 |
| Slovaks | 63.1 /100 | #165 | Good $103,729 |
Demographics Similar to Latvians by Median Family Income
In terms of median family income, the demographic groups most similar to Latvians are Immigrants from Sri Lanka ($120,263, a difference of 0.030%), Immigrants from Denmark ($120,445, a difference of 0.12%), Russian ($120,487, a difference of 0.15%), Immigrants from France ($120,076, a difference of 0.19%), and Asian ($119,955, a difference of 0.29%).
| Demographics | Rating | Rank | Median Family Income |
| Immigrants | Sweden | 100.0 /100 | #22 | Exceptional $122,765 |
| Immigrants | Japan | 100.0 /100 | #23 | Exceptional $122,764 |
| Immigrants | Northern Europe | 100.0 /100 | #24 | Exceptional $121,840 |
| Turks | 100.0 /100 | #25 | Exceptional $121,202 |
| Immigrants | Switzerland | 100.0 /100 | #26 | Exceptional $120,726 |
| Russians | 100.0 /100 | #27 | Exceptional $120,487 |
| Immigrants | Denmark | 100.0 /100 | #28 | Exceptional $120,445 |
| Latvians | 100.0 /100 | #29 | Exceptional $120,301 |
| Immigrants | Sri Lanka | 100.0 /100 | #30 | Exceptional $120,263 |
| Immigrants | France | 100.0 /100 | #31 | Exceptional $120,076 |
| Asians | 100.0 /100 | #32 | Exceptional $119,955 |
| Bhutanese | 100.0 /100 | #33 | Exceptional $119,800 |
| Bolivians | 100.0 /100 | #34 | Exceptional $119,479 |
| Soviet Union | 100.0 /100 | #35 | Exceptional $119,262 |
| Israelis | 100.0 /100 | #36 | Exceptional $118,577 |