Vietnamese vs Latvian Nursery School
COMPARE
Vietnamese
Latvian
Nursery School
Nursery School Comparison
Vietnamese
Latvians
96.8%
NURSERY SCHOOL
0.0/ 100
METRIC RATING
324th/ 347
METRIC RANK
98.5%
NURSERY SCHOOL
99.9/ 100
METRIC RATING
39th/ 347
METRIC RANK
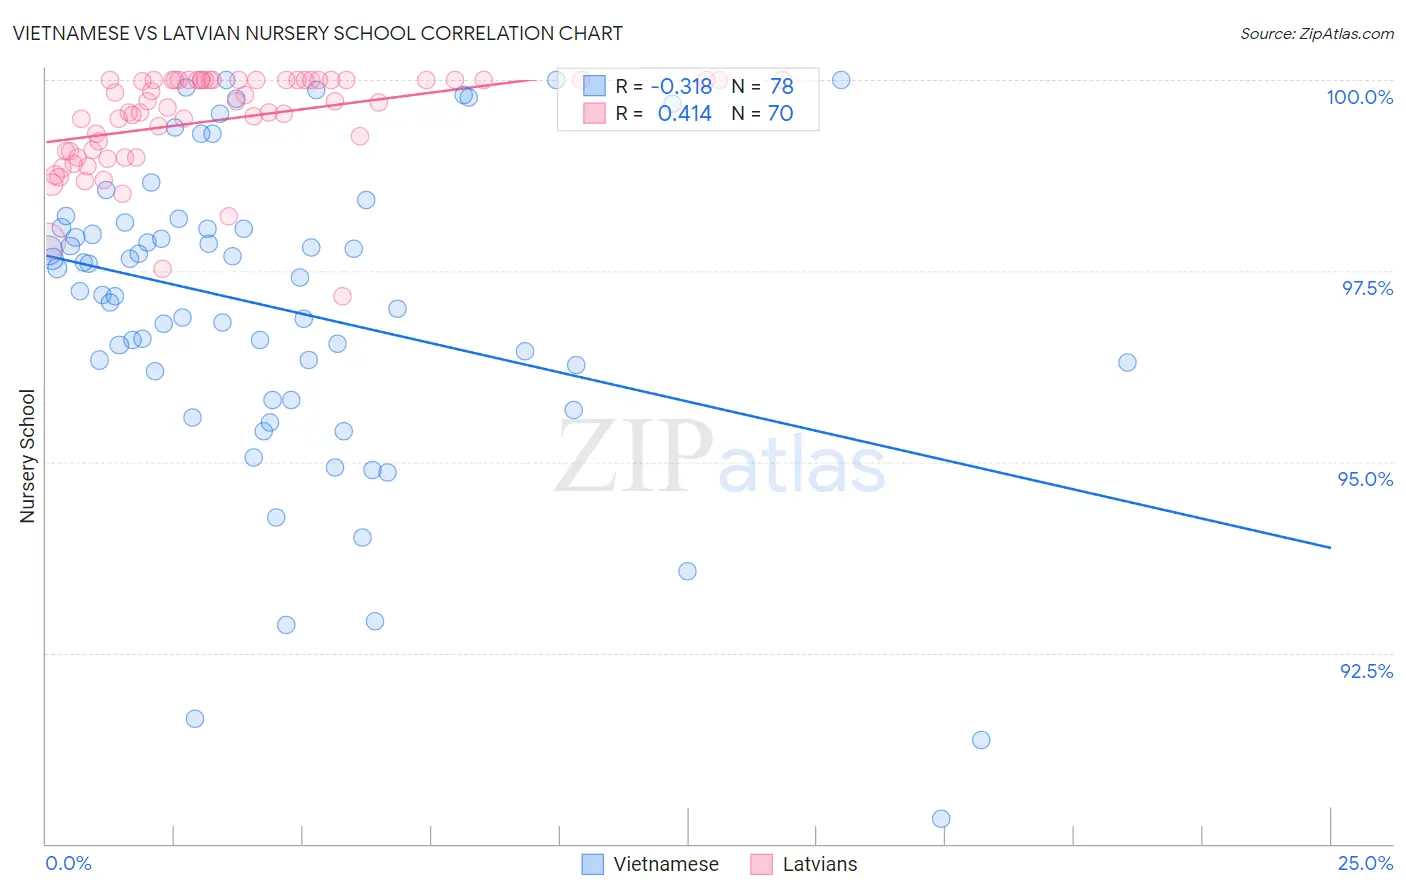
Vietnamese vs Latvian Nursery School Correlation Chart
The statistical analysis conducted on geographies consisting of 170,753,564 people shows a mild negative correlation between the proportion of Vietnamese and percentage of population with at least nursery school education in the United States with a correlation coefficient (R) of -0.318 and weighted average of 96.8%. Similarly, the statistical analysis conducted on geographies consisting of 220,726,452 people shows a moderate positive correlation between the proportion of Latvians and percentage of population with at least nursery school education in the United States with a correlation coefficient (R) of 0.414 and weighted average of 98.5%, a difference of 1.7%.
Nursery School Correlation Summary
| Measurement | Vietnamese | Latvian |
| Minimum | 90.3% | 97.2% |
| Maximum | 100.0% | 100.0% |
| Range | 9.7% | 2.8% |
| Mean | 97.0% | 99.5% |
| Median | 97.3% | 99.7% |
| Interquartile 25% (IQ1) | 96.2% | 99.1% |
| Interquartile 75% (IQ3) | 98.1% | 100.0% |
| Interquartile Range (IQR) | 1.9% | 0.94% |
| Standard Deviation (Sample) | 2.0% | 0.64% |
| Standard Deviation (Population) | 2.0% | 0.64% |
Similar Demographics by Nursery School
Demographics Similar to Vietnamese by Nursery School
In terms of nursery school, the demographic groups most similar to Vietnamese are Immigrants from Honduras (96.9%, a difference of 0.010%), Mexican American Indian (96.9%, a difference of 0.020%), Immigrants from Bangladesh (96.9%, a difference of 0.030%), Dominican (96.8%, a difference of 0.030%), and Indonesian (96.8%, a difference of 0.030%).
| Demographics | Rating | Rank | Nursery School |
| Immigrants | Ecuador | 0.0 /100 | #317 | Tragic 96.9% |
| Immigrants | Guyana | 0.0 /100 | #318 | Tragic 96.9% |
| Immigrants | Laos | 0.0 /100 | #319 | Tragic 96.9% |
| Immigrants | Burma/Myanmar | 0.0 /100 | #320 | Tragic 96.9% |
| Immigrants | Bangladesh | 0.0 /100 | #321 | Tragic 96.9% |
| Mexican American Indians | 0.0 /100 | #322 | Tragic 96.9% |
| Immigrants | Honduras | 0.0 /100 | #323 | Tragic 96.9% |
| Vietnamese | 0.0 /100 | #324 | Tragic 96.8% |
| Dominicans | 0.0 /100 | #325 | Tragic 96.8% |
| Indonesians | 0.0 /100 | #326 | Tragic 96.8% |
| Mexicans | 0.0 /100 | #327 | Tragic 96.8% |
| Immigrants | Latin America | 0.0 /100 | #328 | Tragic 96.7% |
| Immigrants | Vietnam | 0.0 /100 | #329 | Tragic 96.7% |
| Japanese | 0.0 /100 | #330 | Tragic 96.7% |
| Immigrants | Armenia | 0.0 /100 | #331 | Tragic 96.7% |
Demographics Similar to Latvians by Nursery School
In terms of nursery school, the demographic groups most similar to Latvians are Italian (98.5%, a difference of 0.0%), Chippewa (98.5%, a difference of 0.0%), Lumbee (98.5%, a difference of 0.010%), Luxembourger (98.5%, a difference of 0.010%), and Eastern European (98.5%, a difference of 0.010%).
| Demographics | Rating | Rank | Nursery School |
| French Canadians | 100.0 /100 | #32 | Exceptional 98.6% |
| Scandinavians | 100.0 /100 | #33 | Exceptional 98.6% |
| Chinese | 100.0 /100 | #34 | Exceptional 98.6% |
| Swiss | 100.0 /100 | #35 | Exceptional 98.6% |
| British | 100.0 /100 | #36 | Exceptional 98.5% |
| Lumbee | 99.9 /100 | #37 | Exceptional 98.5% |
| Italians | 99.9 /100 | #38 | Exceptional 98.5% |
| Latvians | 99.9 /100 | #39 | Exceptional 98.5% |
| Chippewa | 99.9 /100 | #40 | Exceptional 98.5% |
| Luxembourgers | 99.9 /100 | #41 | Exceptional 98.5% |
| Eastern Europeans | 99.9 /100 | #42 | Exceptional 98.5% |
| Native Hawaiians | 99.9 /100 | #43 | Exceptional 98.5% |
| Belgians | 99.9 /100 | #44 | Exceptional 98.5% |
| Northern Europeans | 99.9 /100 | #45 | Exceptional 98.5% |
| Hungarians | 99.9 /100 | #46 | Exceptional 98.5% |