Vietnamese vs Immigrants from Thailand Householder Income Ages 45 - 64 years
COMPARE
Vietnamese
Immigrants from Thailand
Householder Income Ages 45 - 64 years
Householder Income Ages 45 - 64 years Comparison
Vietnamese
Immigrants from Thailand
$93,788
HOUSEHOLDER INCOME AGES 45 - 64 YEARS
3.6/ 100
METRIC RATING
229th/ 347
METRIC RANK
$97,400
HOUSEHOLDER INCOME AGES 45 - 64 YEARS
18.8/ 100
METRIC RATING
203rd/ 347
METRIC RANK
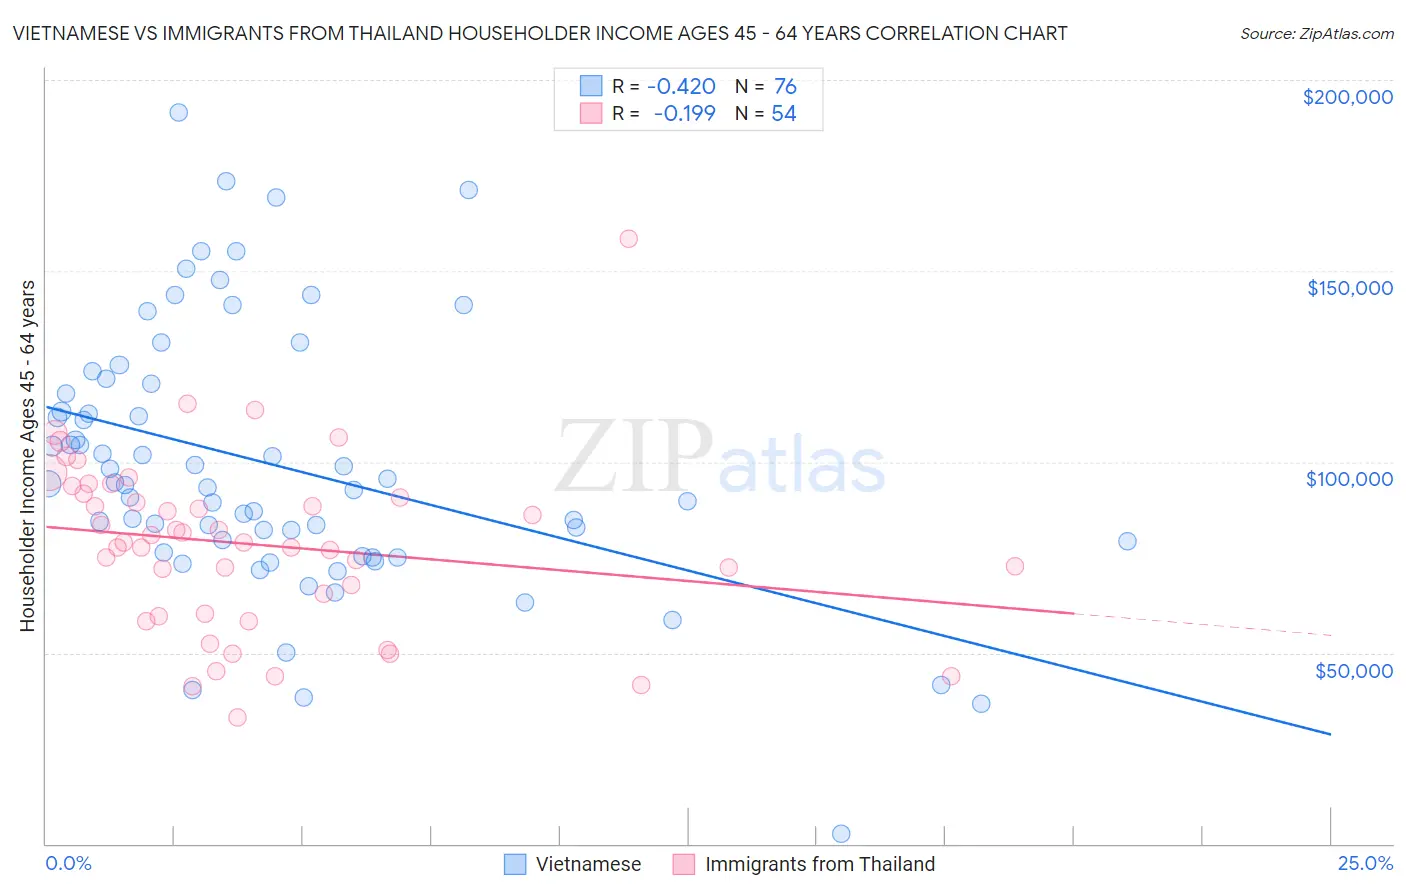
Vietnamese vs Immigrants from Thailand Householder Income Ages 45 - 64 years Correlation Chart
The statistical analysis conducted on geographies consisting of 170,554,464 people shows a moderate negative correlation between the proportion of Vietnamese and household income with householder between the ages 45 and 64 in the United States with a correlation coefficient (R) of -0.420 and weighted average of $93,788. Similarly, the statistical analysis conducted on geographies consisting of 316,747,183 people shows a poor negative correlation between the proportion of Immigrants from Thailand and household income with householder between the ages 45 and 64 in the United States with a correlation coefficient (R) of -0.199 and weighted average of $97,400, a difference of 3.8%.
Householder Income Ages 45 - 64 years Correlation Summary
| Measurement | Vietnamese | Immigrants from Thailand |
| Minimum | $2,499 | $32,910 |
| Maximum | $191,429 | $158,417 |
| Range | $188,930 | $125,507 |
| Mean | $99,011 | $78,332 |
| Median | $94,156 | $78,883 |
| Interquartile 25% (IQ1) | $77,796 | $60,388 |
| Interquartile 75% (IQ3) | $119,213 | $91,575 |
| Interquartile Range (IQR) | $41,417 | $31,186 |
| Standard Deviation (Sample) | $34,793 | $23,014 |
| Standard Deviation (Population) | $34,563 | $22,800 |
Similar Demographics by Householder Income Ages 45 - 64 years
Demographics Similar to Vietnamese by Householder Income Ages 45 - 64 years
In terms of householder income ages 45 - 64 years, the demographic groups most similar to Vietnamese are Immigrants from Sudan ($93,781, a difference of 0.010%), Immigrants from Panama ($93,815, a difference of 0.030%), Ecuadorian ($93,739, a difference of 0.050%), Sudanese ($93,718, a difference of 0.070%), and Alaska Native ($93,991, a difference of 0.22%).
| Demographics | Rating | Rank | Householder Income Ages 45 - 64 years |
| Malaysians | 5.2 /100 | #222 | Tragic $94,517 |
| Immigrants | Nonimmigrants | 5.0 /100 | #223 | Tragic $94,448 |
| Immigrants | Bosnia and Herzegovina | 4.6 /100 | #224 | Tragic $94,288 |
| Bermudans | 4.4 /100 | #225 | Tragic $94,197 |
| Immigrants | Azores | 4.3 /100 | #226 | Tragic $94,138 |
| Alaska Natives | 4.0 /100 | #227 | Tragic $93,991 |
| Immigrants | Panama | 3.7 /100 | #228 | Tragic $93,815 |
| Vietnamese | 3.6 /100 | #229 | Tragic $93,788 |
| Immigrants | Sudan | 3.6 /100 | #230 | Tragic $93,781 |
| Ecuadorians | 3.6 /100 | #231 | Tragic $93,739 |
| Sudanese | 3.5 /100 | #232 | Tragic $93,718 |
| Nepalese | 3.0 /100 | #233 | Tragic $93,355 |
| Immigrants | El Salvador | 2.7 /100 | #234 | Tragic $93,176 |
| Nicaraguans | 2.0 /100 | #235 | Tragic $92,554 |
| Immigrants | Western Africa | 1.8 /100 | #236 | Tragic $92,384 |
Demographics Similar to Immigrants from Thailand by Householder Income Ages 45 - 64 years
In terms of householder income ages 45 - 64 years, the demographic groups most similar to Immigrants from Thailand are Tlingit-Haida ($97,417, a difference of 0.020%), Immigrants from Eritrea ($97,373, a difference of 0.030%), Immigrants from Colombia ($97,290, a difference of 0.11%), Immigrants from Africa ($97,284, a difference of 0.12%), and Ghanaian ($97,277, a difference of 0.13%).
| Demographics | Rating | Rank | Householder Income Ages 45 - 64 years |
| Immigrants | Eastern Africa | 28.3 /100 | #196 | Fair $98,467 |
| Puget Sound Salish | 27.0 /100 | #197 | Fair $98,340 |
| Immigrants | Iraq | 25.7 /100 | #198 | Fair $98,201 |
| Whites/Caucasians | 24.6 /100 | #199 | Fair $98,091 |
| Immigrants | Kenya | 23.5 /100 | #200 | Fair $97,964 |
| Yugoslavians | 20.0 /100 | #201 | Fair $97,558 |
| Tlingit-Haida | 18.9 /100 | #202 | Poor $97,417 |
| Immigrants | Thailand | 18.8 /100 | #203 | Poor $97,400 |
| Immigrants | Eritrea | 18.6 /100 | #204 | Poor $97,373 |
| Immigrants | Colombia | 18.0 /100 | #205 | Poor $97,290 |
| Immigrants | Africa | 17.9 /100 | #206 | Poor $97,284 |
| Ghanaians | 17.9 /100 | #207 | Poor $97,277 |
| Scotch-Irish | 16.4 /100 | #208 | Poor $97,073 |
| Japanese | 14.8 /100 | #209 | Poor $96,834 |
| Tsimshian | 14.5 /100 | #210 | Poor $96,783 |