Immigrants from Kuwait vs Immigrants from Thailand Householder Income Ages 45 - 64 years
COMPARE
Immigrants from Kuwait
Immigrants from Thailand
Householder Income Ages 45 - 64 years
Householder Income Ages 45 - 64 years Comparison
Immigrants from Kuwait
Immigrants from Thailand
$106,285
HOUSEHOLDER INCOME AGES 45 - 64 YEARS
95.2/ 100
METRIC RATING
115th/ 347
METRIC RANK
$97,400
HOUSEHOLDER INCOME AGES 45 - 64 YEARS
18.8/ 100
METRIC RATING
203rd/ 347
METRIC RANK
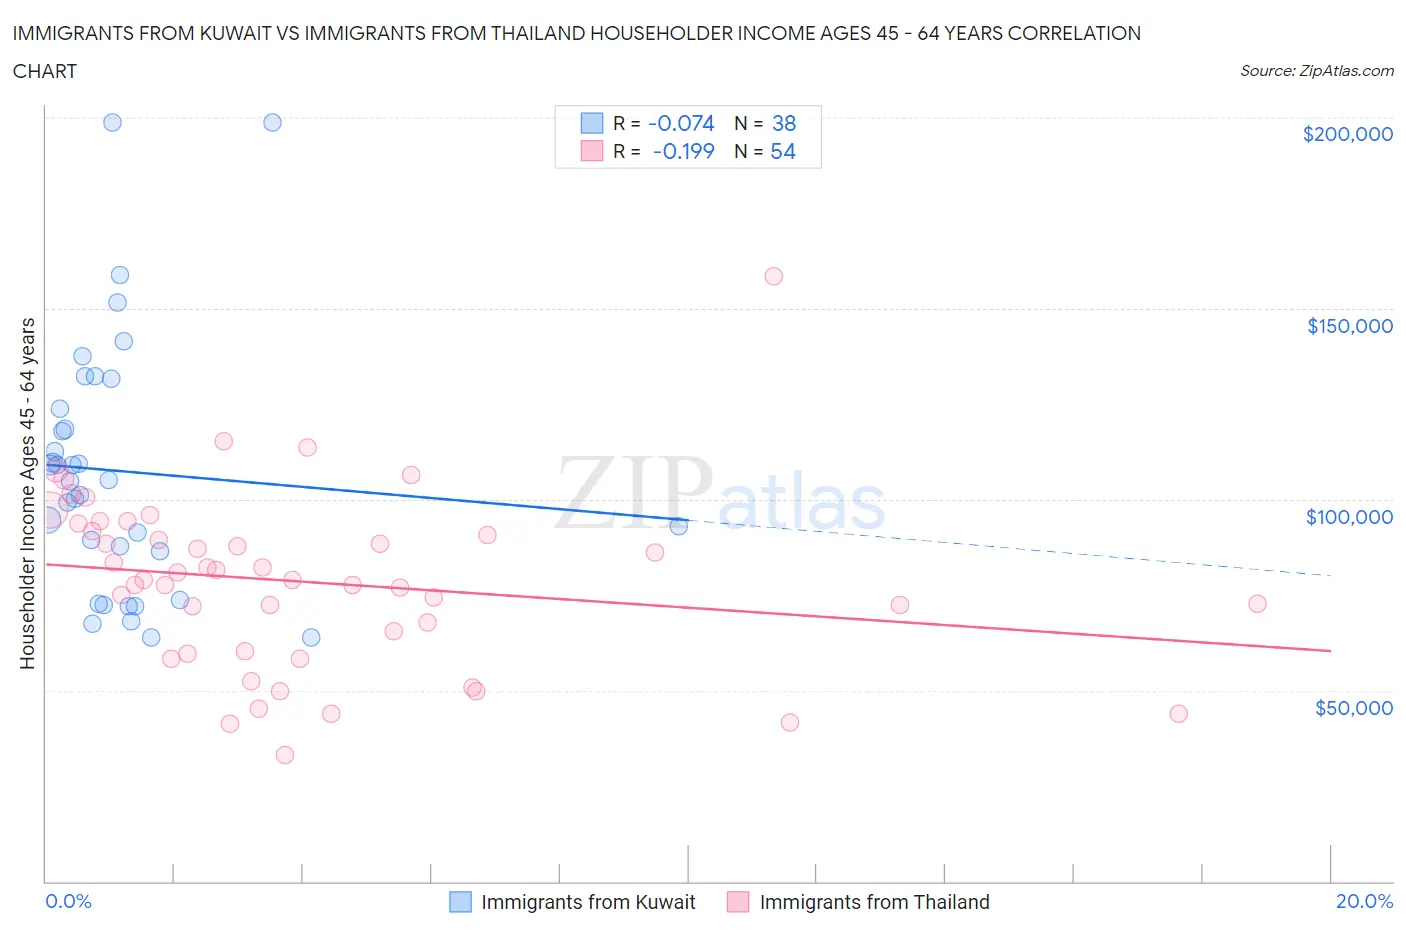
Immigrants from Kuwait vs Immigrants from Thailand Householder Income Ages 45 - 64 years Correlation Chart
The statistical analysis conducted on geographies consisting of 136,856,886 people shows a slight negative correlation between the proportion of Immigrants from Kuwait and household income with householder between the ages 45 and 64 in the United States with a correlation coefficient (R) of -0.074 and weighted average of $106,285. Similarly, the statistical analysis conducted on geographies consisting of 316,747,183 people shows a poor negative correlation between the proportion of Immigrants from Thailand and household income with householder between the ages 45 and 64 in the United States with a correlation coefficient (R) of -0.199 and weighted average of $97,400, a difference of 9.1%.
Householder Income Ages 45 - 64 years Correlation Summary
| Measurement | Immigrants from Kuwait | Immigrants from Thailand |
| Minimum | $63,767 | $32,910 |
| Maximum | $198,648 | $158,417 |
| Range | $134,881 | $125,507 |
| Mean | $107,348 | $78,332 |
| Median | $104,899 | $78,883 |
| Interquartile 25% (IQ1) | $86,528 | $60,388 |
| Interquartile 75% (IQ3) | $123,748 | $91,575 |
| Interquartile Range (IQR) | $37,220 | $31,186 |
| Standard Deviation (Sample) | $33,135 | $23,014 |
| Standard Deviation (Population) | $32,696 | $22,800 |
Similar Demographics by Householder Income Ages 45 - 64 years
Demographics Similar to Immigrants from Kuwait by Householder Income Ages 45 - 64 years
In terms of householder income ages 45 - 64 years, the demographic groups most similar to Immigrants from Kuwait are British ($106,264, a difference of 0.020%), Immigrants from Poland ($106,319, a difference of 0.030%), Albanian ($106,243, a difference of 0.040%), Immigrants from Western Asia ($106,217, a difference of 0.060%), and European ($106,367, a difference of 0.080%).
| Demographics | Rating | Rank | Householder Income Ages 45 - 64 years |
| Zimbabweans | 96.3 /100 | #108 | Exceptional $106,849 |
| Chileans | 95.9 /100 | #109 | Exceptional $106,611 |
| Immigrants | Brazil | 95.6 /100 | #110 | Exceptional $106,470 |
| Immigrants | Vietnam | 95.5 /100 | #111 | Exceptional $106,417 |
| Swedes | 95.4 /100 | #112 | Exceptional $106,377 |
| Europeans | 95.4 /100 | #113 | Exceptional $106,367 |
| Immigrants | Poland | 95.3 /100 | #114 | Exceptional $106,319 |
| Immigrants | Kuwait | 95.2 /100 | #115 | Exceptional $106,285 |
| British | 95.2 /100 | #116 | Exceptional $106,264 |
| Albanians | 95.1 /100 | #117 | Exceptional $106,243 |
| Immigrants | Western Asia | 95.0 /100 | #118 | Exceptional $106,217 |
| Immigrants | Jordan | 94.9 /100 | #119 | Exceptional $106,164 |
| Immigrants | South Eastern Asia | 94.8 /100 | #120 | Exceptional $106,109 |
| Poles | 94.4 /100 | #121 | Exceptional $105,952 |
| Immigrants | North Macedonia | 94.2 /100 | #122 | Exceptional $105,892 |
Demographics Similar to Immigrants from Thailand by Householder Income Ages 45 - 64 years
In terms of householder income ages 45 - 64 years, the demographic groups most similar to Immigrants from Thailand are Tlingit-Haida ($97,417, a difference of 0.020%), Immigrants from Eritrea ($97,373, a difference of 0.030%), Immigrants from Colombia ($97,290, a difference of 0.11%), Immigrants from Africa ($97,284, a difference of 0.12%), and Ghanaian ($97,277, a difference of 0.13%).
| Demographics | Rating | Rank | Householder Income Ages 45 - 64 years |
| Immigrants | Eastern Africa | 28.3 /100 | #196 | Fair $98,467 |
| Puget Sound Salish | 27.0 /100 | #197 | Fair $98,340 |
| Immigrants | Iraq | 25.7 /100 | #198 | Fair $98,201 |
| Whites/Caucasians | 24.6 /100 | #199 | Fair $98,091 |
| Immigrants | Kenya | 23.5 /100 | #200 | Fair $97,964 |
| Yugoslavians | 20.0 /100 | #201 | Fair $97,558 |
| Tlingit-Haida | 18.9 /100 | #202 | Poor $97,417 |
| Immigrants | Thailand | 18.8 /100 | #203 | Poor $97,400 |
| Immigrants | Eritrea | 18.6 /100 | #204 | Poor $97,373 |
| Immigrants | Colombia | 18.0 /100 | #205 | Poor $97,290 |
| Immigrants | Africa | 17.9 /100 | #206 | Poor $97,284 |
| Ghanaians | 17.9 /100 | #207 | Poor $97,277 |
| Scotch-Irish | 16.4 /100 | #208 | Poor $97,073 |
| Japanese | 14.8 /100 | #209 | Poor $96,834 |
| Tsimshian | 14.5 /100 | #210 | Poor $96,783 |