Vietnamese vs Immigrants from Thailand Female Unemployment
COMPARE
Vietnamese
Immigrants from Thailand
Female Unemployment
Female Unemployment Comparison
Vietnamese
Immigrants from Thailand
6.5%
FEMALE UNEMPLOYMENT
0.0/ 100
METRIC RATING
322nd/ 347
METRIC RANK
5.2%
FEMALE UNEMPLOYMENT
62.1/ 100
METRIC RATING
167th/ 347
METRIC RANK
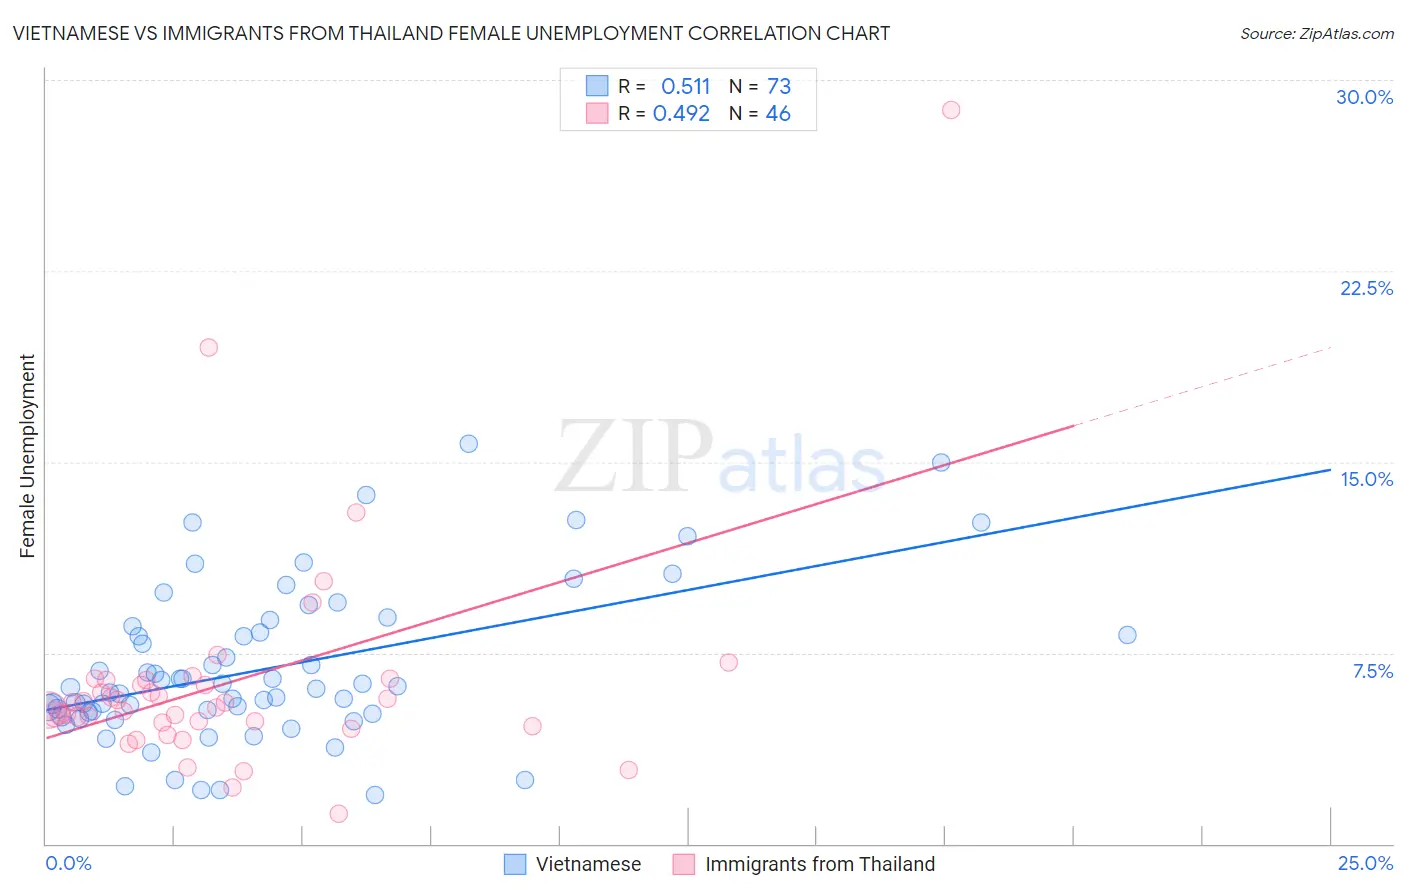
Vietnamese vs Immigrants from Thailand Female Unemployment Correlation Chart
The statistical analysis conducted on geographies consisting of 170,617,487 people shows a substantial positive correlation between the proportion of Vietnamese and unemploymnet rate among females in the United States with a correlation coefficient (R) of 0.511 and weighted average of 6.5%. Similarly, the statistical analysis conducted on geographies consisting of 316,285,605 people shows a moderate positive correlation between the proportion of Immigrants from Thailand and unemploymnet rate among females in the United States with a correlation coefficient (R) of 0.492 and weighted average of 5.2%, a difference of 24.5%.
Female Unemployment Correlation Summary
| Measurement | Vietnamese | Immigrants from Thailand |
| Minimum | 1.9% | 1.2% |
| Maximum | 15.7% | 28.8% |
| Range | 13.8% | 27.6% |
| Mean | 6.9% | 6.3% |
| Median | 6.1% | 5.5% |
| Interquartile 25% (IQ1) | 5.1% | 4.8% |
| Interquartile 75% (IQ3) | 8.4% | 6.4% |
| Interquartile Range (IQR) | 3.3% | 1.7% |
| Standard Deviation (Sample) | 3.0% | 4.4% |
| Standard Deviation (Population) | 3.0% | 4.4% |
Similar Demographics by Female Unemployment
Demographics Similar to Vietnamese by Female Unemployment
In terms of female unemployment, the demographic groups most similar to Vietnamese are Black/African American (6.5%, a difference of 0.080%), Immigrants from Belize (6.5%, a difference of 0.10%), Immigrants from Dominica (6.5%, a difference of 0.62%), Immigrants from Bangladesh (6.5%, a difference of 0.63%), and British West Indian (6.4%, a difference of 0.82%).
| Demographics | Rating | Rank | Female Unemployment |
| Pueblo | 0.0 /100 | #315 | Tragic 6.4% |
| Houma | 0.0 /100 | #316 | Tragic 6.4% |
| Immigrants | St. Vincent and the Grenadines | 0.0 /100 | #317 | Tragic 6.4% |
| British West Indians | 0.0 /100 | #318 | Tragic 6.4% |
| Immigrants | Bangladesh | 0.0 /100 | #319 | Tragic 6.5% |
| Immigrants | Dominica | 0.0 /100 | #320 | Tragic 6.5% |
| Blacks/African Americans | 0.0 /100 | #321 | Tragic 6.5% |
| Vietnamese | 0.0 /100 | #322 | Tragic 6.5% |
| Immigrants | Belize | 0.0 /100 | #323 | Tragic 6.5% |
| Cheyenne | 0.0 /100 | #324 | Tragic 6.6% |
| Apache | 0.0 /100 | #325 | Tragic 6.6% |
| Natives/Alaskans | 0.0 /100 | #326 | Tragic 6.6% |
| Alaska Natives | 0.0 /100 | #327 | Tragic 6.6% |
| Guyanese | 0.0 /100 | #328 | Tragic 6.7% |
| Immigrants | Guyana | 0.0 /100 | #329 | Tragic 6.7% |
Demographics Similar to Immigrants from Thailand by Female Unemployment
In terms of female unemployment, the demographic groups most similar to Immigrants from Thailand are Syrian (5.2%, a difference of 0.040%), Native Hawaiian (5.2%, a difference of 0.040%), Immigrants from Asia (5.2%, a difference of 0.14%), Bangladeshi (5.2%, a difference of 0.14%), and Sri Lankan (5.2%, a difference of 0.17%).
| Demographics | Rating | Rank | Female Unemployment |
| Immigrants | Spain | 66.8 /100 | #160 | Good 5.2% |
| Immigrants | Pakistan | 66.7 /100 | #161 | Good 5.2% |
| Potawatomi | 65.9 /100 | #162 | Good 5.2% |
| Immigrants | Asia | 64.3 /100 | #163 | Good 5.2% |
| Bangladeshis | 64.3 /100 | #164 | Good 5.2% |
| Syrians | 62.8 /100 | #165 | Good 5.2% |
| Native Hawaiians | 62.7 /100 | #166 | Good 5.2% |
| Immigrants | Thailand | 62.1 /100 | #167 | Good 5.2% |
| Sri Lankans | 59.4 /100 | #168 | Average 5.2% |
| Immigrants | Chile | 59.0 /100 | #169 | Average 5.2% |
| Spanish | 55.9 /100 | #170 | Average 5.2% |
| Immigrants | Denmark | 55.0 /100 | #171 | Average 5.2% |
| Immigrants | Uganda | 50.7 /100 | #172 | Average 5.3% |
| Iranians | 50.4 /100 | #173 | Average 5.3% |
| Immigrants | Poland | 50.0 /100 | #174 | Average 5.3% |