Spaniard vs Immigrants from Thailand Householder Income Ages 45 - 64 years
COMPARE
Spaniard
Immigrants from Thailand
Householder Income Ages 45 - 64 years
Householder Income Ages 45 - 64 years Comparison
Spaniards
Immigrants from Thailand
$99,889
HOUSEHOLDER INCOME AGES 45 - 64 YEARS
44.6/ 100
METRIC RATING
183rd/ 347
METRIC RANK
$97,400
HOUSEHOLDER INCOME AGES 45 - 64 YEARS
18.8/ 100
METRIC RATING
203rd/ 347
METRIC RANK
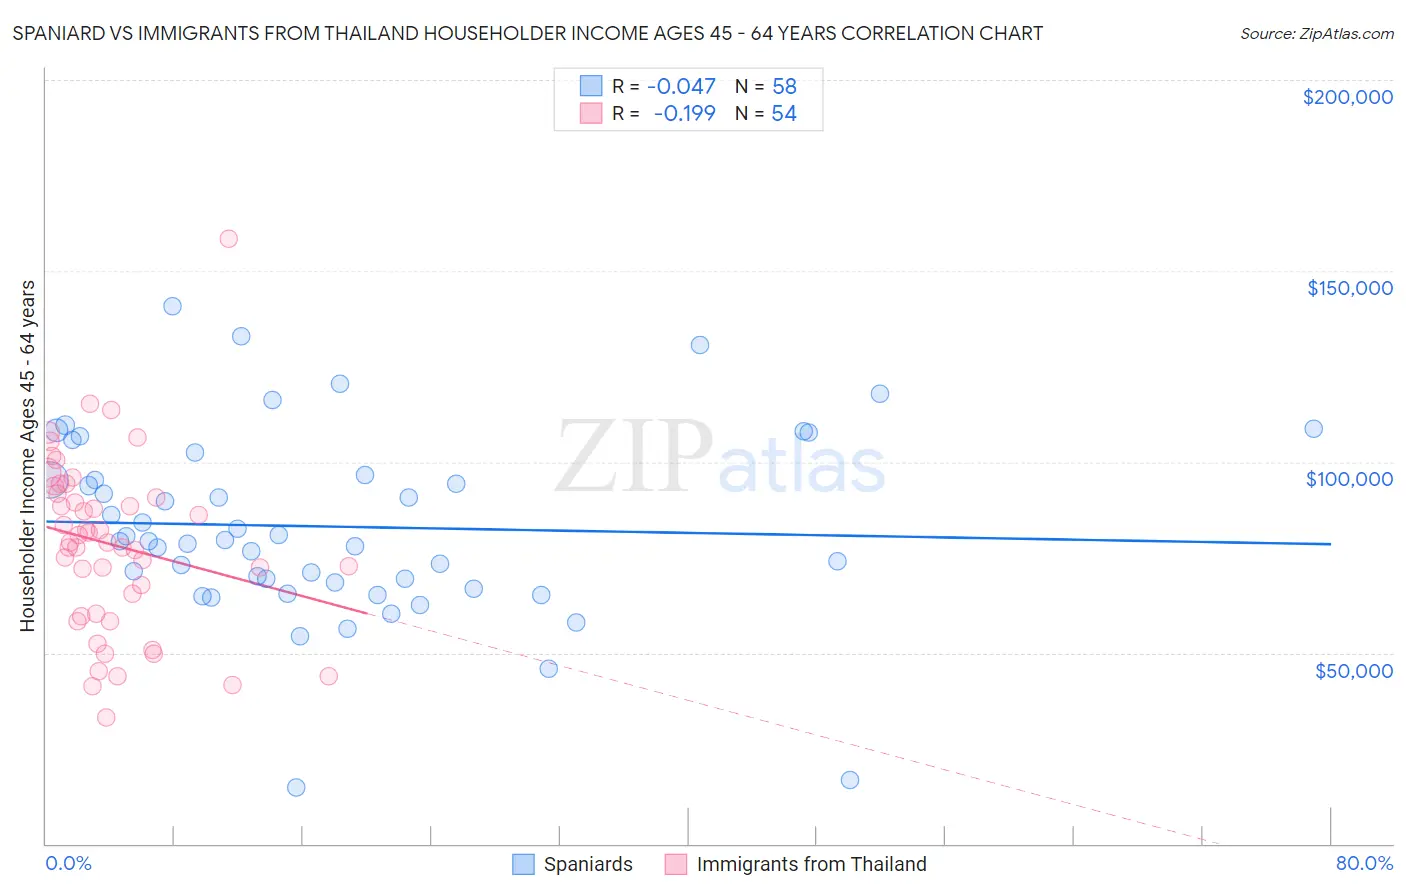
Spaniard vs Immigrants from Thailand Householder Income Ages 45 - 64 years Correlation Chart
The statistical analysis conducted on geographies consisting of 442,373,323 people shows no correlation between the proportion of Spaniards and household income with householder between the ages 45 and 64 in the United States with a correlation coefficient (R) of -0.047 and weighted average of $99,889. Similarly, the statistical analysis conducted on geographies consisting of 316,747,183 people shows a poor negative correlation between the proportion of Immigrants from Thailand and household income with householder between the ages 45 and 64 in the United States with a correlation coefficient (R) of -0.199 and weighted average of $97,400, a difference of 2.6%.
Householder Income Ages 45 - 64 years Correlation Summary
| Measurement | Spaniard | Immigrants from Thailand |
| Minimum | $14,806 | $32,910 |
| Maximum | $140,801 | $158,417 |
| Range | $125,995 | $125,507 |
| Mean | $83,048 | $78,332 |
| Median | $79,425 | $78,883 |
| Interquartile 25% (IQ1) | $68,311 | $60,388 |
| Interquartile 75% (IQ3) | $96,594 | $91,575 |
| Interquartile Range (IQR) | $28,282 | $31,186 |
| Standard Deviation (Sample) | $24,571 | $23,014 |
| Standard Deviation (Population) | $24,358 | $22,800 |
Demographics Similar to Spaniards and Immigrants from Thailand by Householder Income Ages 45 - 64 years
In terms of householder income ages 45 - 64 years, the demographic groups most similar to Spaniards are French ($99,824, a difference of 0.070%), Colombian ($99,772, a difference of 0.12%), Dutch ($99,650, a difference of 0.24%), Iraqi ($99,387, a difference of 0.51%), and Immigrants from Portugal ($99,203, a difference of 0.69%). Similarly, the demographic groups most similar to Immigrants from Thailand are Tlingit-Haida ($97,417, a difference of 0.020%), Yugoslavian ($97,558, a difference of 0.16%), Immigrants from Kenya ($97,964, a difference of 0.58%), White/Caucasian ($98,091, a difference of 0.71%), and Immigrants from Iraq ($98,201, a difference of 0.82%).
| Demographics | Rating | Rank | Householder Income Ages 45 - 64 years |
| Spaniards | 44.6 /100 | #183 | Average $99,889 |
| French | 43.8 /100 | #184 | Average $99,824 |
| Colombians | 43.2 /100 | #185 | Average $99,772 |
| Dutch | 41.7 /100 | #186 | Average $99,650 |
| Iraqis | 38.5 /100 | #187 | Fair $99,387 |
| Immigrants | Portugal | 36.3 /100 | #188 | Fair $99,203 |
| Immigrants | South America | 35.4 /100 | #189 | Fair $99,126 |
| French Canadians | 35.1 /100 | #190 | Fair $99,093 |
| Kenyans | 33.7 /100 | #191 | Fair $98,970 |
| Celtics | 32.9 /100 | #192 | Fair $98,896 |
| Hawaiians | 31.6 /100 | #193 | Fair $98,778 |
| Uruguayans | 30.3 /100 | #194 | Fair $98,660 |
| Spanish | 29.2 /100 | #195 | Fair $98,554 |
| Immigrants | Eastern Africa | 28.3 /100 | #196 | Fair $98,467 |
| Puget Sound Salish | 27.0 /100 | #197 | Fair $98,340 |
| Immigrants | Iraq | 25.7 /100 | #198 | Fair $98,201 |
| Whites/Caucasians | 24.6 /100 | #199 | Fair $98,091 |
| Immigrants | Kenya | 23.5 /100 | #200 | Fair $97,964 |
| Yugoslavians | 20.0 /100 | #201 | Fair $97,558 |
| Tlingit-Haida | 18.9 /100 | #202 | Poor $97,417 |
| Immigrants | Thailand | 18.8 /100 | #203 | Poor $97,400 |