Immigrants from Morocco vs Immigrants from Thailand Householder Income Ages 45 - 64 years
COMPARE
Immigrants from Morocco
Immigrants from Thailand
Householder Income Ages 45 - 64 years
Householder Income Ages 45 - 64 years Comparison
Immigrants from Morocco
Immigrants from Thailand
$102,015
HOUSEHOLDER INCOME AGES 45 - 64 YEARS
70.0/ 100
METRIC RATING
164th/ 347
METRIC RANK
$97,400
HOUSEHOLDER INCOME AGES 45 - 64 YEARS
18.8/ 100
METRIC RATING
203rd/ 347
METRIC RANK
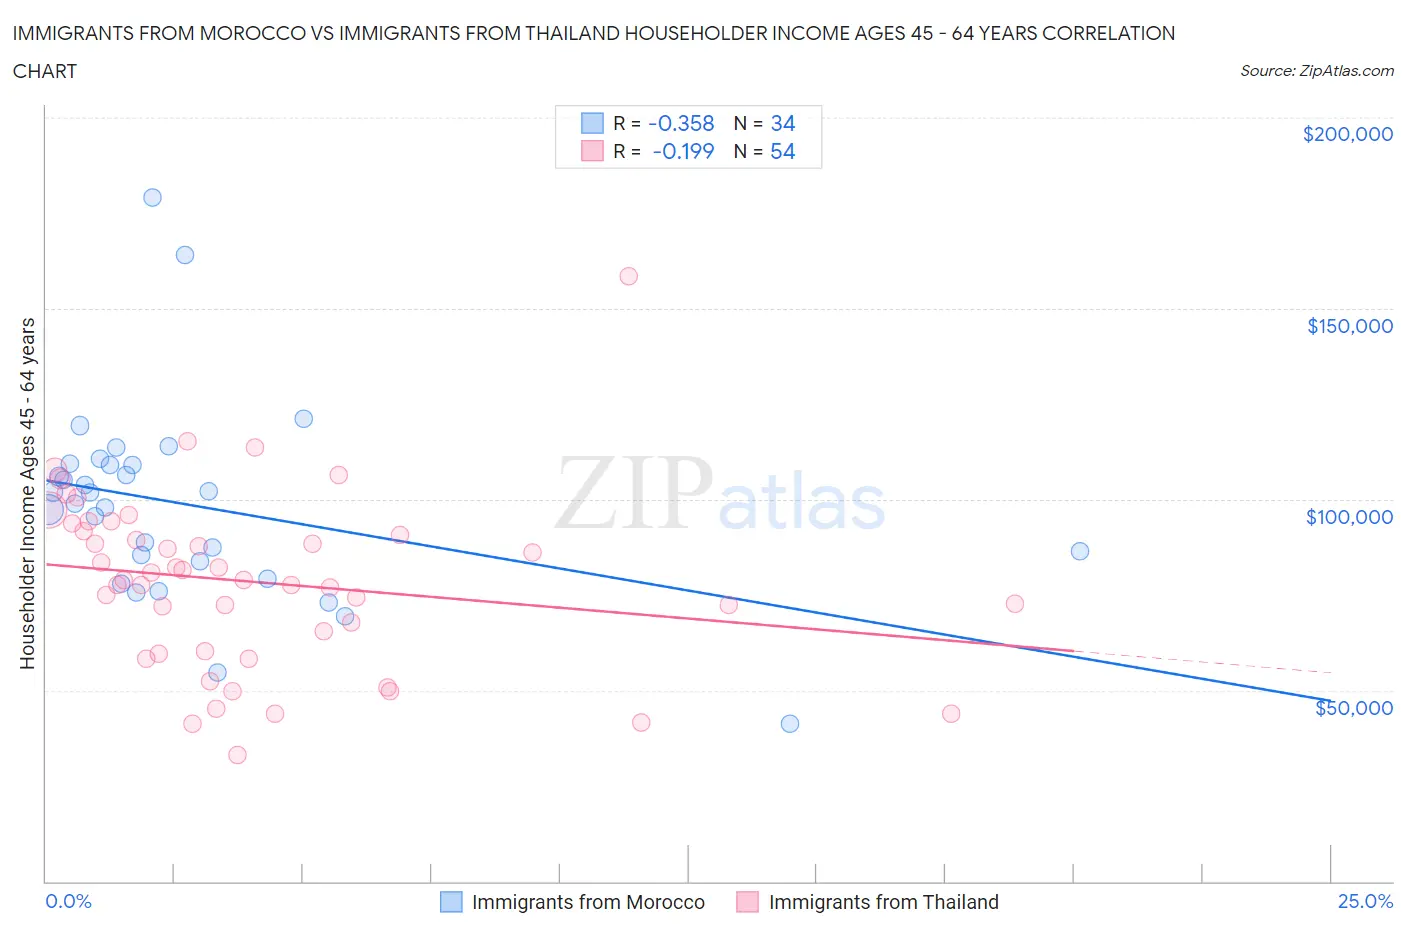
Immigrants from Morocco vs Immigrants from Thailand Householder Income Ages 45 - 64 years Correlation Chart
The statistical analysis conducted on geographies consisting of 178,864,321 people shows a mild negative correlation between the proportion of Immigrants from Morocco and household income with householder between the ages 45 and 64 in the United States with a correlation coefficient (R) of -0.358 and weighted average of $102,015. Similarly, the statistical analysis conducted on geographies consisting of 316,747,183 people shows a poor negative correlation between the proportion of Immigrants from Thailand and household income with householder between the ages 45 and 64 in the United States with a correlation coefficient (R) of -0.199 and weighted average of $97,400, a difference of 4.7%.
Householder Income Ages 45 - 64 years Correlation Summary
| Measurement | Immigrants from Morocco | Immigrants from Thailand |
| Minimum | $41,250 | $32,910 |
| Maximum | $179,202 | $158,417 |
| Range | $137,952 | $125,507 |
| Mean | $98,384 | $78,332 |
| Median | $100,229 | $78,883 |
| Interquartile 25% (IQ1) | $83,916 | $60,388 |
| Interquartile 75% (IQ3) | $109,003 | $91,575 |
| Interquartile Range (IQR) | $25,087 | $31,186 |
| Standard Deviation (Sample) | $25,952 | $23,014 |
| Standard Deviation (Population) | $25,567 | $22,800 |
Similar Demographics by Householder Income Ages 45 - 64 years
Demographics Similar to Immigrants from Morocco by Householder Income Ages 45 - 64 years
In terms of householder income ages 45 - 64 years, the demographic groups most similar to Immigrants from Morocco are English ($102,021, a difference of 0.010%), Immigrants from Albania ($101,957, a difference of 0.060%), Scottish ($102,123, a difference of 0.11%), Immigrants from Nepal ($102,190, a difference of 0.17%), and Icelander ($102,261, a difference of 0.24%).
| Demographics | Rating | Rank | Householder Income Ages 45 - 64 years |
| Immigrants | Ethiopia | 77.3 /100 | #157 | Good $102,763 |
| Slavs | 76.1 /100 | #158 | Good $102,629 |
| Sierra Leoneans | 74.2 /100 | #159 | Good $102,427 |
| Icelanders | 72.5 /100 | #160 | Good $102,261 |
| Immigrants | Nepal | 71.8 /100 | #161 | Good $102,190 |
| Scottish | 71.1 /100 | #162 | Good $102,123 |
| English | 70.1 /100 | #163 | Good $102,021 |
| Immigrants | Morocco | 70.0 /100 | #164 | Good $102,015 |
| Immigrants | Albania | 69.4 /100 | #165 | Good $101,957 |
| Samoans | 65.3 /100 | #166 | Good $101,580 |
| Czechoslovakians | 63.0 /100 | #167 | Good $101,387 |
| South American Indians | 60.5 /100 | #168 | Good $101,171 |
| Guamanians/Chamorros | 60.5 /100 | #169 | Good $101,170 |
| Slovaks | 58.8 /100 | #170 | Average $101,029 |
| South Americans | 56.4 /100 | #171 | Average $100,837 |
Demographics Similar to Immigrants from Thailand by Householder Income Ages 45 - 64 years
In terms of householder income ages 45 - 64 years, the demographic groups most similar to Immigrants from Thailand are Tlingit-Haida ($97,417, a difference of 0.020%), Immigrants from Eritrea ($97,373, a difference of 0.030%), Immigrants from Colombia ($97,290, a difference of 0.11%), Immigrants from Africa ($97,284, a difference of 0.12%), and Ghanaian ($97,277, a difference of 0.13%).
| Demographics | Rating | Rank | Householder Income Ages 45 - 64 years |
| Immigrants | Eastern Africa | 28.3 /100 | #196 | Fair $98,467 |
| Puget Sound Salish | 27.0 /100 | #197 | Fair $98,340 |
| Immigrants | Iraq | 25.7 /100 | #198 | Fair $98,201 |
| Whites/Caucasians | 24.6 /100 | #199 | Fair $98,091 |
| Immigrants | Kenya | 23.5 /100 | #200 | Fair $97,964 |
| Yugoslavians | 20.0 /100 | #201 | Fair $97,558 |
| Tlingit-Haida | 18.9 /100 | #202 | Poor $97,417 |
| Immigrants | Thailand | 18.8 /100 | #203 | Poor $97,400 |
| Immigrants | Eritrea | 18.6 /100 | #204 | Poor $97,373 |
| Immigrants | Colombia | 18.0 /100 | #205 | Poor $97,290 |
| Immigrants | Africa | 17.9 /100 | #206 | Poor $97,284 |
| Ghanaians | 17.9 /100 | #207 | Poor $97,277 |
| Scotch-Irish | 16.4 /100 | #208 | Poor $97,073 |
| Japanese | 14.8 /100 | #209 | Poor $96,834 |
| Tsimshian | 14.5 /100 | #210 | Poor $96,783 |