Immigrants from Latvia vs Immigrants from Thailand Householder Income Ages 45 - 64 years
COMPARE
Immigrants from Latvia
Immigrants from Thailand
Householder Income Ages 45 - 64 years
Householder Income Ages 45 - 64 years Comparison
Immigrants from Latvia
Immigrants from Thailand
$111,454
HOUSEHOLDER INCOME AGES 45 - 64 YEARS
99.6/ 100
METRIC RATING
64th/ 347
METRIC RANK
$97,400
HOUSEHOLDER INCOME AGES 45 - 64 YEARS
18.8/ 100
METRIC RATING
203rd/ 347
METRIC RANK
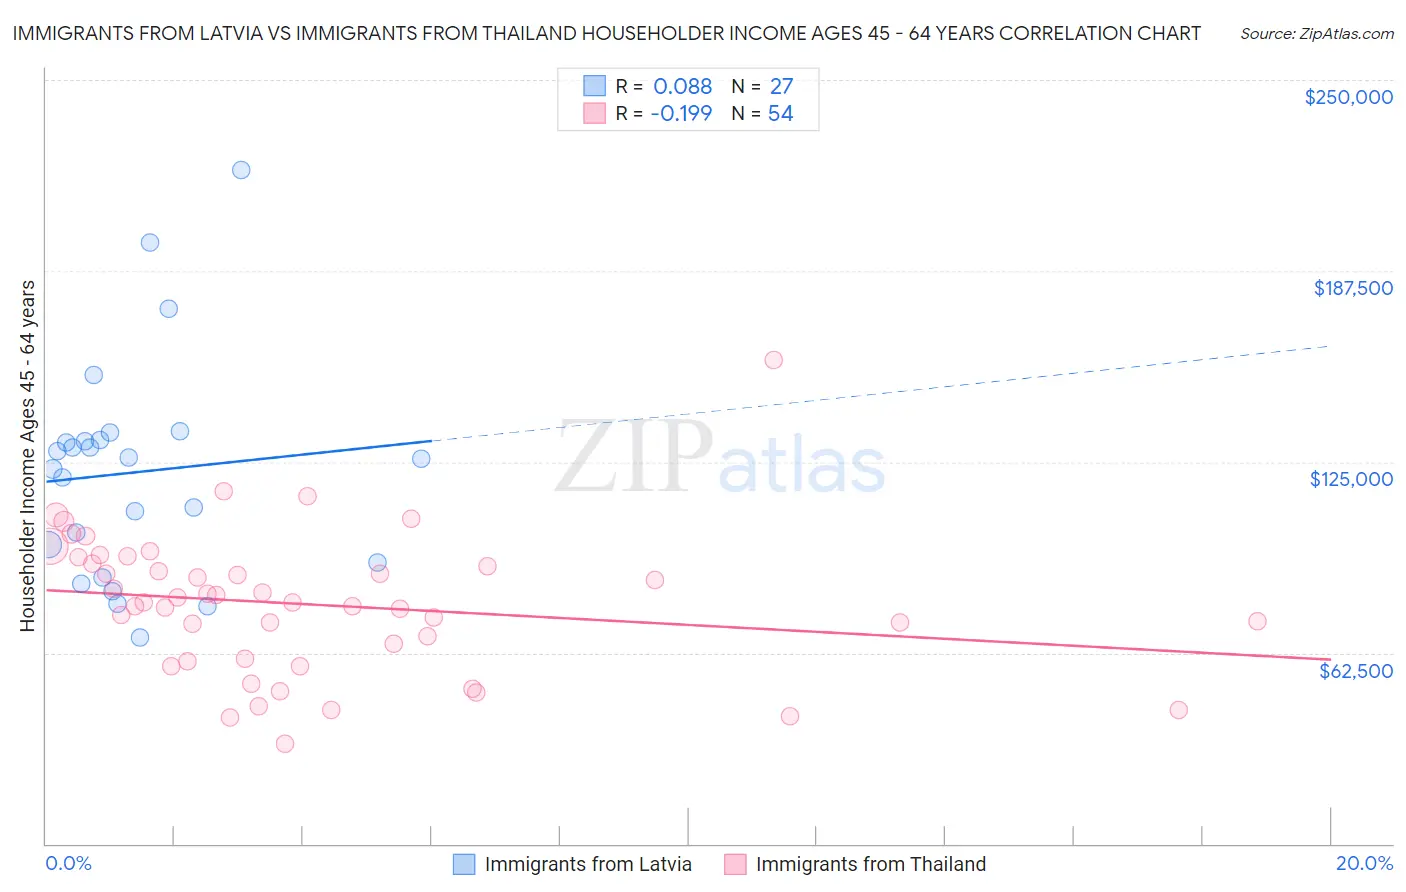
Immigrants from Latvia vs Immigrants from Thailand Householder Income Ages 45 - 64 years Correlation Chart
The statistical analysis conducted on geographies consisting of 113,705,895 people shows a slight positive correlation between the proportion of Immigrants from Latvia and household income with householder between the ages 45 and 64 in the United States with a correlation coefficient (R) of 0.088 and weighted average of $111,454. Similarly, the statistical analysis conducted on geographies consisting of 316,747,183 people shows a poor negative correlation between the proportion of Immigrants from Thailand and household income with householder between the ages 45 and 64 in the United States with a correlation coefficient (R) of -0.199 and weighted average of $97,400, a difference of 14.4%.
Householder Income Ages 45 - 64 years Correlation Summary
| Measurement | Immigrants from Latvia | Immigrants from Thailand |
| Minimum | $67,390 | $32,910 |
| Maximum | $220,625 | $158,417 |
| Range | $153,235 | $125,507 |
| Mean | $121,613 | $78,332 |
| Median | $126,071 | $78,883 |
| Interquartile 25% (IQ1) | $92,091 | $60,388 |
| Interquartile 75% (IQ3) | $132,271 | $91,575 |
| Interquartile Range (IQR) | $40,180 | $31,186 |
| Standard Deviation (Sample) | $35,656 | $23,014 |
| Standard Deviation (Population) | $34,989 | $22,800 |
Similar Demographics by Householder Income Ages 45 - 64 years
Demographics Similar to Immigrants from Latvia by Householder Income Ages 45 - 64 years
In terms of householder income ages 45 - 64 years, the demographic groups most similar to Immigrants from Latvia are Immigrants from Belarus ($111,430, a difference of 0.020%), Mongolian ($111,602, a difference of 0.13%), New Zealander ($111,286, a difference of 0.15%), Immigrants from Norway ($111,669, a difference of 0.19%), and Laotian ($111,051, a difference of 0.36%).
| Demographics | Rating | Rank | Householder Income Ages 45 - 64 years |
| Immigrants | Scotland | 99.7 /100 | #57 | Exceptional $112,175 |
| Soviet Union | 99.7 /100 | #58 | Exceptional $112,008 |
| Immigrants | Europe | 99.7 /100 | #59 | Exceptional $111,984 |
| Immigrants | Netherlands | 99.7 /100 | #60 | Exceptional $111,982 |
| Immigrants | Czechoslovakia | 99.7 /100 | #61 | Exceptional $111,914 |
| Immigrants | Norway | 99.7 /100 | #62 | Exceptional $111,669 |
| Mongolians | 99.6 /100 | #63 | Exceptional $111,602 |
| Immigrants | Latvia | 99.6 /100 | #64 | Exceptional $111,454 |
| Immigrants | Belarus | 99.6 /100 | #65 | Exceptional $111,430 |
| New Zealanders | 99.6 /100 | #66 | Exceptional $111,286 |
| Laotians | 99.5 /100 | #67 | Exceptional $111,051 |
| Immigrants | Romania | 99.4 /100 | #68 | Exceptional $110,633 |
| Immigrants | Italy | 99.4 /100 | #69 | Exceptional $110,434 |
| Koreans | 99.3 /100 | #70 | Exceptional $110,334 |
| Italians | 99.3 /100 | #71 | Exceptional $110,224 |
Demographics Similar to Immigrants from Thailand by Householder Income Ages 45 - 64 years
In terms of householder income ages 45 - 64 years, the demographic groups most similar to Immigrants from Thailand are Tlingit-Haida ($97,417, a difference of 0.020%), Immigrants from Eritrea ($97,373, a difference of 0.030%), Immigrants from Colombia ($97,290, a difference of 0.11%), Immigrants from Africa ($97,284, a difference of 0.12%), and Ghanaian ($97,277, a difference of 0.13%).
| Demographics | Rating | Rank | Householder Income Ages 45 - 64 years |
| Immigrants | Eastern Africa | 28.3 /100 | #196 | Fair $98,467 |
| Puget Sound Salish | 27.0 /100 | #197 | Fair $98,340 |
| Immigrants | Iraq | 25.7 /100 | #198 | Fair $98,201 |
| Whites/Caucasians | 24.6 /100 | #199 | Fair $98,091 |
| Immigrants | Kenya | 23.5 /100 | #200 | Fair $97,964 |
| Yugoslavians | 20.0 /100 | #201 | Fair $97,558 |
| Tlingit-Haida | 18.9 /100 | #202 | Poor $97,417 |
| Immigrants | Thailand | 18.8 /100 | #203 | Poor $97,400 |
| Immigrants | Eritrea | 18.6 /100 | #204 | Poor $97,373 |
| Immigrants | Colombia | 18.0 /100 | #205 | Poor $97,290 |
| Immigrants | Africa | 17.9 /100 | #206 | Poor $97,284 |
| Ghanaians | 17.9 /100 | #207 | Poor $97,277 |
| Scotch-Irish | 16.4 /100 | #208 | Poor $97,073 |
| Japanese | 14.8 /100 | #209 | Poor $96,834 |
| Tsimshian | 14.5 /100 | #210 | Poor $96,783 |