Ute vs Guyanese Per Capita Income
COMPARE
Ute
Guyanese
Per Capita Income
Per Capita Income Comparison
Ute
Guyanese
$36,651
PER CAPITA INCOME
0.0/ 100
METRIC RATING
310th/ 347
METRIC RANK
$40,949
PER CAPITA INCOME
4.5/ 100
METRIC RATING
232nd/ 347
METRIC RANK
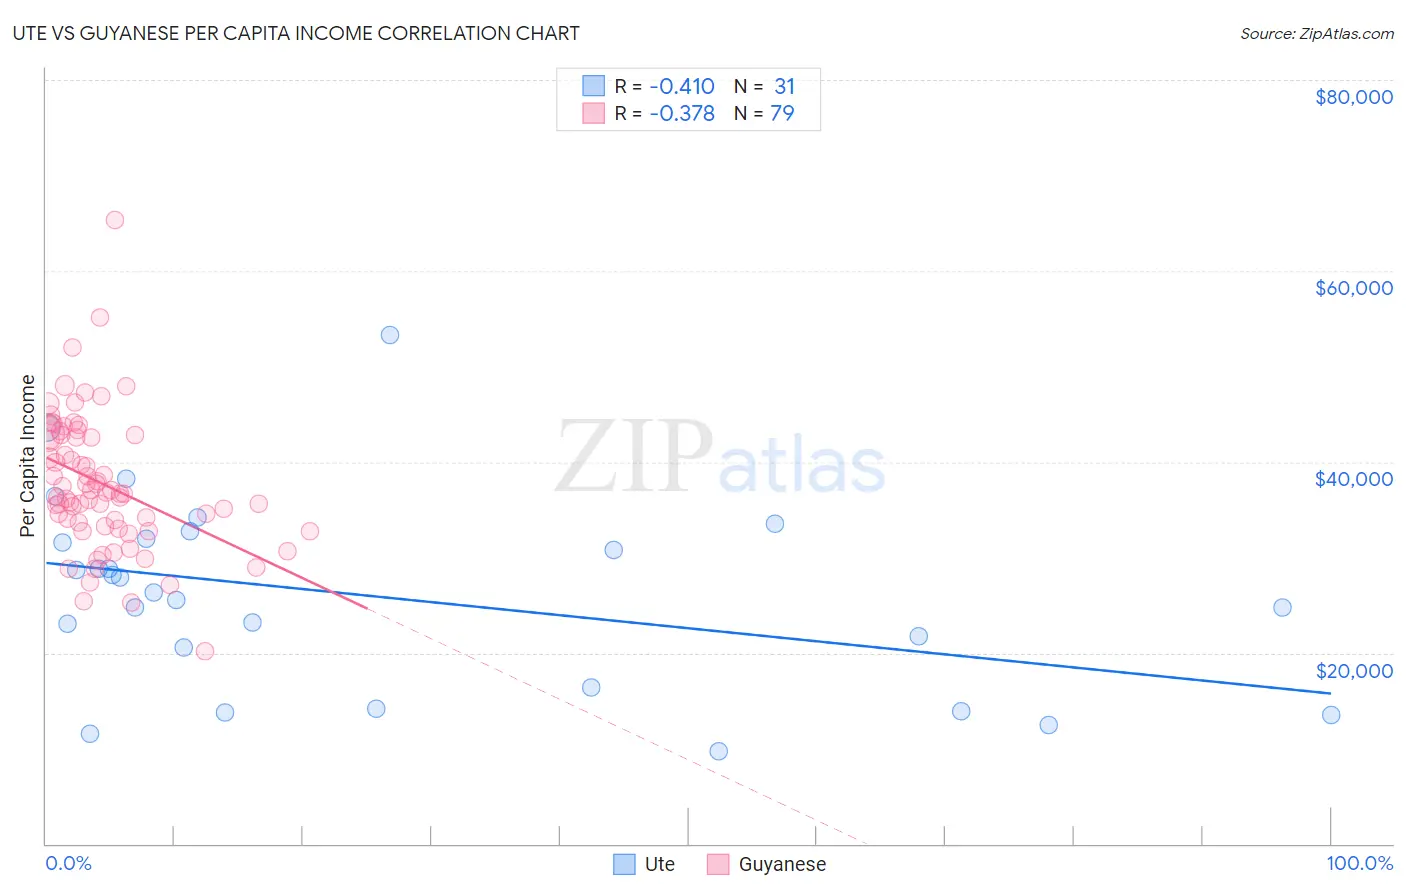
Ute vs Guyanese Per Capita Income Correlation Chart
The statistical analysis conducted on geographies consisting of 55,660,141 people shows a moderate negative correlation between the proportion of Ute and per capita income in the United States with a correlation coefficient (R) of -0.410 and weighted average of $36,651. Similarly, the statistical analysis conducted on geographies consisting of 176,945,802 people shows a mild negative correlation between the proportion of Guyanese and per capita income in the United States with a correlation coefficient (R) of -0.378 and weighted average of $40,949, a difference of 11.7%.
Per Capita Income Correlation Summary
| Measurement | Ute | Guyanese |
| Minimum | $9,749 | $20,131 |
| Maximum | $53,279 | $65,314 |
| Range | $43,530 | $45,183 |
| Mean | $25,907 | $37,694 |
| Median | $26,299 | $36,719 |
| Interquartile 25% (IQ1) | $16,307 | $33,285 |
| Interquartile 75% (IQ3) | $31,910 | $42,829 |
| Interquartile Range (IQR) | $15,603 | $9,544 |
| Standard Deviation (Sample) | $10,024 | $7,132 |
| Standard Deviation (Population) | $9,861 | $7,087 |
Similar Demographics by Per Capita Income
Demographics Similar to Ute by Per Capita Income
In terms of per capita income, the demographic groups most similar to Ute are Immigrants from Honduras ($36,665, a difference of 0.040%), Chippewa ($36,631, a difference of 0.060%), Fijian ($36,690, a difference of 0.10%), Immigrants from Latin America ($36,823, a difference of 0.47%), and Chickasaw ($36,475, a difference of 0.48%).
| Demographics | Rating | Rank | Per Capita Income |
| Paiute | 0.1 /100 | #303 | Tragic $37,066 |
| Hondurans | 0.1 /100 | #304 | Tragic $37,031 |
| Inupiat | 0.1 /100 | #305 | Tragic $36,999 |
| Immigrants | Haiti | 0.0 /100 | #306 | Tragic $36,849 |
| Immigrants | Latin America | 0.0 /100 | #307 | Tragic $36,823 |
| Fijians | 0.0 /100 | #308 | Tragic $36,690 |
| Immigrants | Honduras | 0.0 /100 | #309 | Tragic $36,665 |
| Ute | 0.0 /100 | #310 | Tragic $36,651 |
| Chippewa | 0.0 /100 | #311 | Tragic $36,631 |
| Chickasaw | 0.0 /100 | #312 | Tragic $36,475 |
| Bahamians | 0.0 /100 | #313 | Tragic $36,427 |
| Seminole | 0.0 /100 | #314 | Tragic $36,180 |
| Yaqui | 0.0 /100 | #315 | Tragic $36,112 |
| Choctaw | 0.0 /100 | #316 | Tragic $35,999 |
| Dutch West Indians | 0.0 /100 | #317 | Tragic $35,922 |
Demographics Similar to Guyanese by Per Capita Income
In terms of per capita income, the demographic groups most similar to Guyanese are Senegalese ($41,000, a difference of 0.12%), Native Hawaiian ($41,017, a difference of 0.16%), Nigerian ($41,026, a difference of 0.19%), Immigrants from Grenada ($41,123, a difference of 0.42%), and Delaware ($40,778, a difference of 0.42%).
| Demographics | Rating | Rank | Per Capita Income |
| West Indians | 6.0 /100 | #225 | Tragic $41,217 |
| Immigrants | Ecuador | 5.9 /100 | #226 | Tragic $41,195 |
| Immigrants | Ghana | 5.5 /100 | #227 | Tragic $41,131 |
| Immigrants | Grenada | 5.5 /100 | #228 | Tragic $41,123 |
| Nigerians | 4.9 /100 | #229 | Tragic $41,026 |
| Native Hawaiians | 4.9 /100 | #230 | Tragic $41,017 |
| Senegalese | 4.8 /100 | #231 | Tragic $41,000 |
| Guyanese | 4.5 /100 | #232 | Tragic $40,949 |
| Delaware | 3.8 /100 | #233 | Tragic $40,778 |
| Immigrants | West Indies | 3.7 /100 | #234 | Tragic $40,763 |
| Immigrants | Guyana | 3.6 /100 | #235 | Tragic $40,742 |
| Immigrants | Nonimmigrants | 3.4 /100 | #236 | Tragic $40,669 |
| Immigrants | Cambodia | 2.6 /100 | #237 | Tragic $40,434 |
| Somalis | 2.4 /100 | #238 | Tragic $40,367 |
| Tsimshian | 2.4 /100 | #239 | Tragic $40,344 |