Armenian vs Immigrants from Guatemala Householder Income Ages 45 - 64 years
COMPARE
Armenian
Immigrants from Guatemala
Householder Income Ages 45 - 64 years
Householder Income Ages 45 - 64 years Comparison
Armenians
Immigrants from Guatemala
$107,002
HOUSEHOLDER INCOME AGES 45 - 64 YEARS
96.6/ 100
METRIC RATING
106th/ 347
METRIC RANK
$86,573
HOUSEHOLDER INCOME AGES 45 - 64 YEARS
0.1/ 100
METRIC RATING
286th/ 347
METRIC RANK
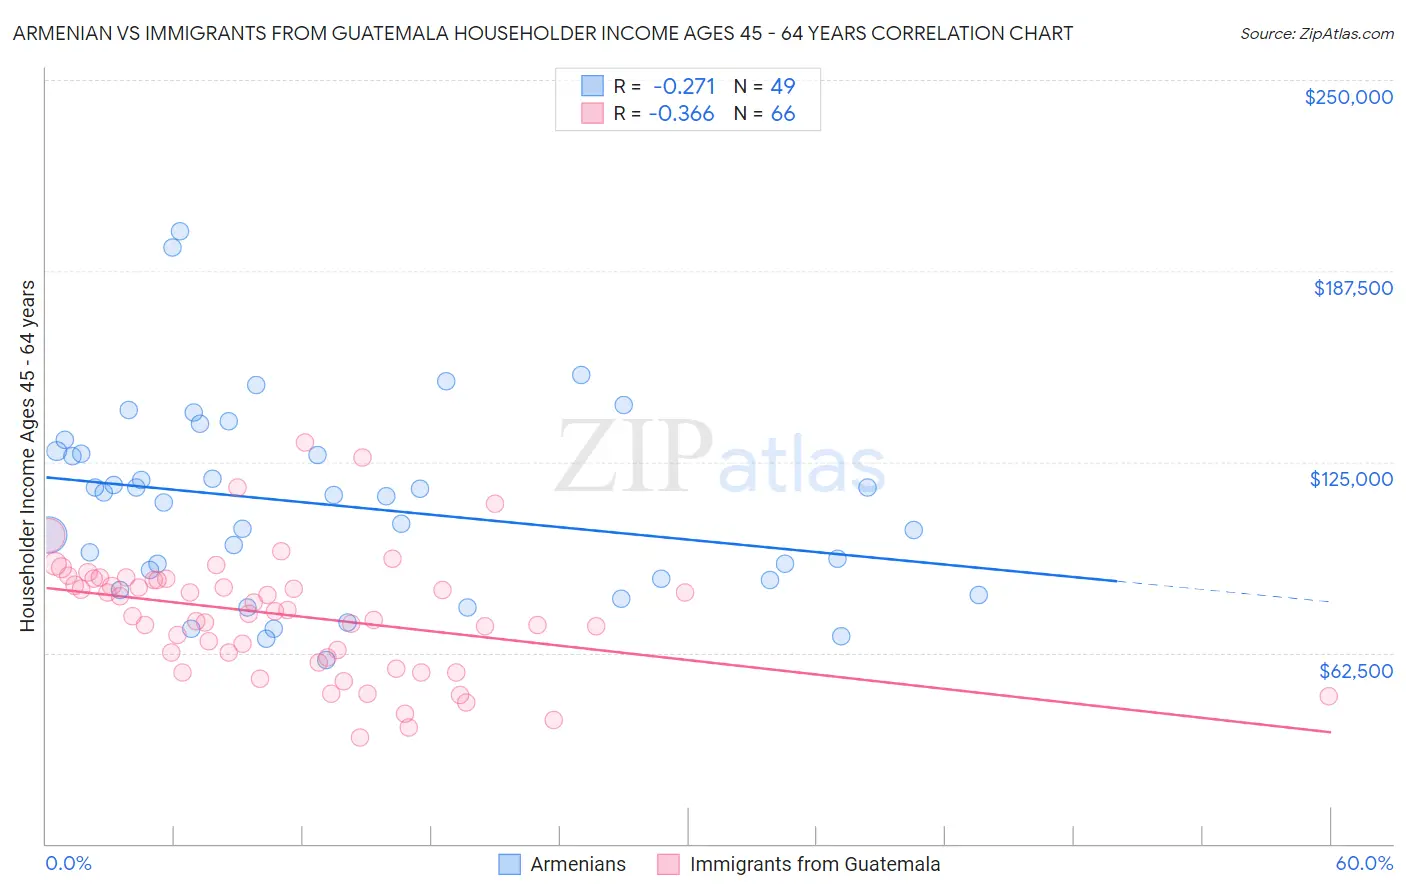
Armenian vs Immigrants from Guatemala Householder Income Ages 45 - 64 years Correlation Chart
The statistical analysis conducted on geographies consisting of 310,526,639 people shows a weak negative correlation between the proportion of Armenians and household income with householder between the ages 45 and 64 in the United States with a correlation coefficient (R) of -0.271 and weighted average of $107,002. Similarly, the statistical analysis conducted on geographies consisting of 376,817,889 people shows a mild negative correlation between the proportion of Immigrants from Guatemala and household income with householder between the ages 45 and 64 in the United States with a correlation coefficient (R) of -0.366 and weighted average of $86,573, a difference of 23.6%.
Householder Income Ages 45 - 64 years Correlation Summary
| Measurement | Armenian | Immigrants from Guatemala |
| Minimum | $60,000 | $34,910 |
| Maximum | $200,625 | $131,185 |
| Range | $140,625 | $96,275 |
| Mean | $110,676 | $74,838 |
| Median | $113,807 | $75,675 |
| Interquartile 25% (IQ1) | $86,427 | $61,091 |
| Interquartile 75% (IQ3) | $128,076 | $86,426 |
| Interquartile Range (IQR) | $41,649 | $25,336 |
| Standard Deviation (Sample) | $30,867 | $19,729 |
| Standard Deviation (Population) | $30,551 | $19,579 |
Similar Demographics by Householder Income Ages 45 - 64 years
Demographics Similar to Armenians by Householder Income Ages 45 - 64 years
In terms of householder income ages 45 - 64 years, the demographic groups most similar to Armenians are Immigrants from Fiji ($106,952, a difference of 0.050%), Immigrants from Ukraine ($107,079, a difference of 0.070%), Macedonian ($107,074, a difference of 0.070%), Zimbabwean ($106,849, a difference of 0.14%), and Syrian ($107,207, a difference of 0.19%).
| Demographics | Rating | Rank | Householder Income Ages 45 - 64 years |
| Palestinians | 97.6 /100 | #99 | Exceptional $107,721 |
| Immigrants | Serbia | 97.4 /100 | #100 | Exceptional $107,569 |
| Immigrants | Kazakhstan | 97.2 /100 | #101 | Exceptional $107,378 |
| Immigrants | Moldova | 97.1 /100 | #102 | Exceptional $107,357 |
| Syrians | 96.9 /100 | #103 | Exceptional $107,207 |
| Immigrants | Ukraine | 96.7 /100 | #104 | Exceptional $107,079 |
| Macedonians | 96.7 /100 | #105 | Exceptional $107,074 |
| Armenians | 96.6 /100 | #106 | Exceptional $107,002 |
| Immigrants | Fiji | 96.5 /100 | #107 | Exceptional $106,952 |
| Zimbabweans | 96.3 /100 | #108 | Exceptional $106,849 |
| Chileans | 95.9 /100 | #109 | Exceptional $106,611 |
| Immigrants | Brazil | 95.6 /100 | #110 | Exceptional $106,470 |
| Immigrants | Vietnam | 95.5 /100 | #111 | Exceptional $106,417 |
| Swedes | 95.4 /100 | #112 | Exceptional $106,377 |
| Europeans | 95.4 /100 | #113 | Exceptional $106,367 |
Demographics Similar to Immigrants from Guatemala by Householder Income Ages 45 - 64 years
In terms of householder income ages 45 - 64 years, the demographic groups most similar to Immigrants from Guatemala are Blackfeet ($86,595, a difference of 0.030%), Bangladeshi ($86,402, a difference of 0.20%), Immigrants from St. Vincent and the Grenadines ($86,394, a difference of 0.21%), Central American Indian ($86,764, a difference of 0.22%), and Mexican ($86,816, a difference of 0.28%).
| Demographics | Rating | Rank | Householder Income Ages 45 - 64 years |
| Yakama | 0.1 /100 | #279 | Tragic $86,992 |
| Immigrants | Somalia | 0.1 /100 | #280 | Tragic $86,987 |
| Yaqui | 0.1 /100 | #281 | Tragic $86,914 |
| Senegalese | 0.1 /100 | #282 | Tragic $86,897 |
| Mexicans | 0.1 /100 | #283 | Tragic $86,816 |
| Central American Indians | 0.1 /100 | #284 | Tragic $86,764 |
| Blackfeet | 0.1 /100 | #285 | Tragic $86,595 |
| Immigrants | Guatemala | 0.1 /100 | #286 | Tragic $86,573 |
| Bangladeshis | 0.1 /100 | #287 | Tragic $86,402 |
| Immigrants | St. Vincent and the Grenadines | 0.1 /100 | #288 | Tragic $86,394 |
| Cubans | 0.1 /100 | #289 | Tragic $86,301 |
| Cherokee | 0.1 /100 | #290 | Tragic $86,125 |
| Hispanics or Latinos | 0.1 /100 | #291 | Tragic $86,006 |
| Immigrants | Central America | 0.1 /100 | #292 | Tragic $85,965 |
| Comanche | 0.1 /100 | #293 | Tragic $85,787 |