Burmese vs Immigrants from Guatemala Householder Income Ages 45 - 64 years
COMPARE
Burmese
Immigrants from Guatemala
Householder Income Ages 45 - 64 years
Householder Income Ages 45 - 64 years Comparison
Burmese
Immigrants from Guatemala
$121,444
HOUSEHOLDER INCOME AGES 45 - 64 YEARS
100.0/ 100
METRIC RATING
17th/ 347
METRIC RANK
$86,573
HOUSEHOLDER INCOME AGES 45 - 64 YEARS
0.1/ 100
METRIC RATING
286th/ 347
METRIC RANK
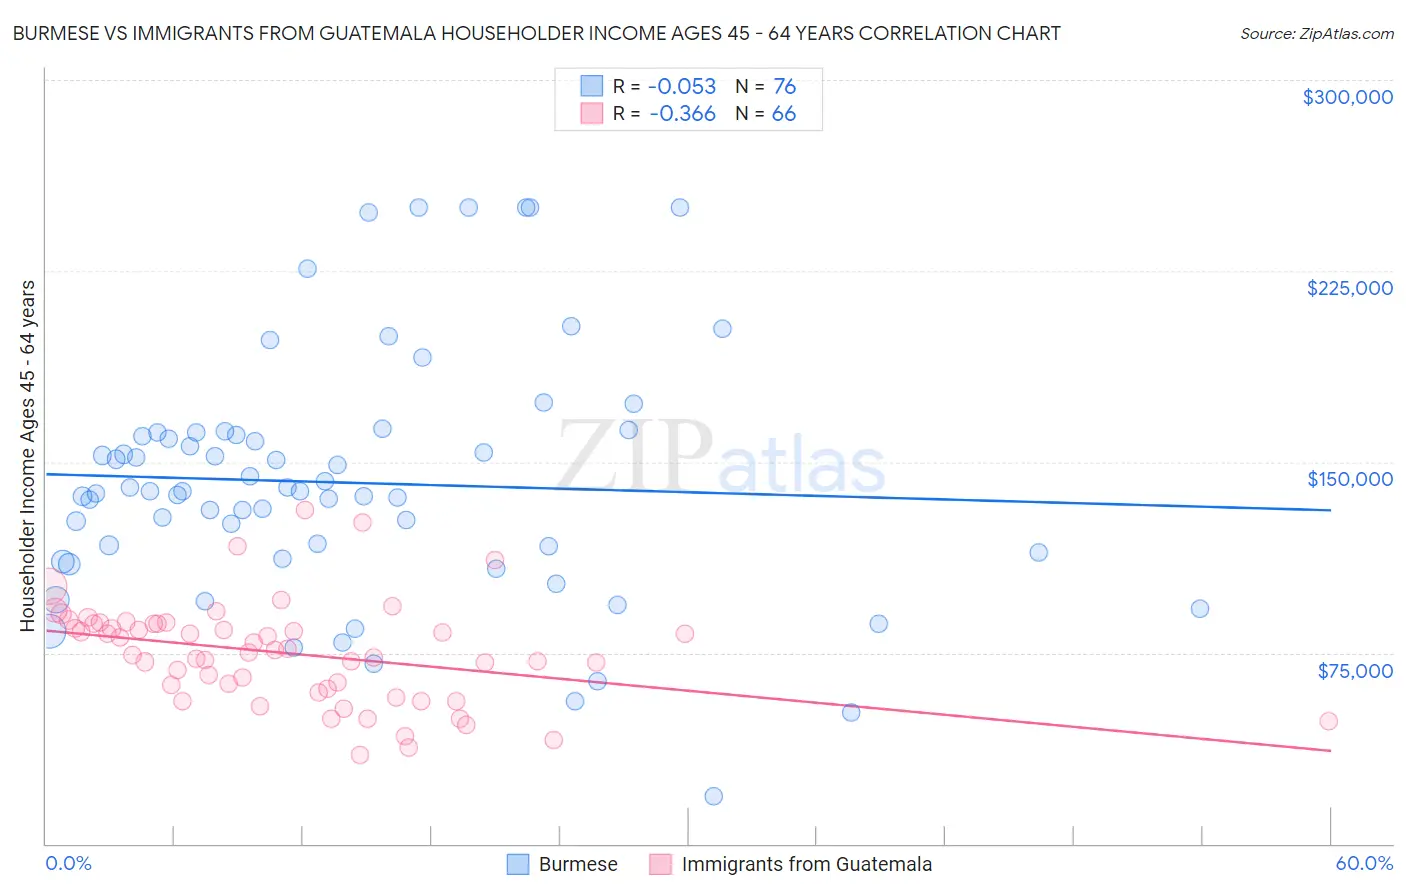
Burmese vs Immigrants from Guatemala Householder Income Ages 45 - 64 years Correlation Chart
The statistical analysis conducted on geographies consisting of 464,084,220 people shows a slight negative correlation between the proportion of Burmese and household income with householder between the ages 45 and 64 in the United States with a correlation coefficient (R) of -0.053 and weighted average of $121,444. Similarly, the statistical analysis conducted on geographies consisting of 376,817,889 people shows a mild negative correlation between the proportion of Immigrants from Guatemala and household income with householder between the ages 45 and 64 in the United States with a correlation coefficient (R) of -0.366 and weighted average of $86,573, a difference of 40.3%.
Householder Income Ages 45 - 64 years Correlation Summary
| Measurement | Burmese | Immigrants from Guatemala |
| Minimum | $18,640 | $34,910 |
| Maximum | $250,001 | $131,185 |
| Range | $231,361 | $96,275 |
| Mean | $141,791 | $74,838 |
| Median | $138,461 | $75,675 |
| Interquartile 25% (IQ1) | $113,099 | $61,091 |
| Interquartile 75% (IQ3) | $160,979 | $86,426 |
| Interquartile Range (IQR) | $47,880 | $25,336 |
| Standard Deviation (Sample) | $48,701 | $19,729 |
| Standard Deviation (Population) | $48,379 | $19,579 |
Similar Demographics by Householder Income Ages 45 - 64 years
Demographics Similar to Burmese by Householder Income Ages 45 - 64 years
In terms of householder income ages 45 - 64 years, the demographic groups most similar to Burmese are Immigrants from Korea ($121,243, a difference of 0.17%), Immigrants from China ($122,178, a difference of 0.60%), Eastern European ($120,684, a difference of 0.63%), Immigrants from Eastern Asia ($122,222, a difference of 0.64%), and Indian (Asian) ($122,343, a difference of 0.74%).
| Demographics | Rating | Rank | Householder Income Ages 45 - 64 years |
| Immigrants | South Central Asia | 100.0 /100 | #10 | Exceptional $124,188 |
| Cypriots | 100.0 /100 | #11 | Exceptional $123,396 |
| Immigrants | Israel | 100.0 /100 | #12 | Exceptional $122,893 |
| Immigrants | Ireland | 100.0 /100 | #13 | Exceptional $122,757 |
| Indians (Asian) | 100.0 /100 | #14 | Exceptional $122,343 |
| Immigrants | Eastern Asia | 100.0 /100 | #15 | Exceptional $122,222 |
| Immigrants | China | 100.0 /100 | #16 | Exceptional $122,178 |
| Burmese | 100.0 /100 | #17 | Exceptional $121,444 |
| Immigrants | Korea | 100.0 /100 | #18 | Exceptional $121,243 |
| Eastern Europeans | 100.0 /100 | #19 | Exceptional $120,684 |
| Immigrants | Australia | 100.0 /100 | #20 | Exceptional $119,308 |
| Immigrants | Sri Lanka | 100.0 /100 | #21 | Exceptional $119,094 |
| Immigrants | Belgium | 100.0 /100 | #22 | Exceptional $118,932 |
| Bolivians | 100.0 /100 | #23 | Exceptional $118,871 |
| Immigrants | Japan | 100.0 /100 | #24 | Exceptional $118,498 |
Demographics Similar to Immigrants from Guatemala by Householder Income Ages 45 - 64 years
In terms of householder income ages 45 - 64 years, the demographic groups most similar to Immigrants from Guatemala are Blackfeet ($86,595, a difference of 0.030%), Bangladeshi ($86,402, a difference of 0.20%), Immigrants from St. Vincent and the Grenadines ($86,394, a difference of 0.21%), Central American Indian ($86,764, a difference of 0.22%), and Mexican ($86,816, a difference of 0.28%).
| Demographics | Rating | Rank | Householder Income Ages 45 - 64 years |
| Yakama | 0.1 /100 | #279 | Tragic $86,992 |
| Immigrants | Somalia | 0.1 /100 | #280 | Tragic $86,987 |
| Yaqui | 0.1 /100 | #281 | Tragic $86,914 |
| Senegalese | 0.1 /100 | #282 | Tragic $86,897 |
| Mexicans | 0.1 /100 | #283 | Tragic $86,816 |
| Central American Indians | 0.1 /100 | #284 | Tragic $86,764 |
| Blackfeet | 0.1 /100 | #285 | Tragic $86,595 |
| Immigrants | Guatemala | 0.1 /100 | #286 | Tragic $86,573 |
| Bangladeshis | 0.1 /100 | #287 | Tragic $86,402 |
| Immigrants | St. Vincent and the Grenadines | 0.1 /100 | #288 | Tragic $86,394 |
| Cubans | 0.1 /100 | #289 | Tragic $86,301 |
| Cherokee | 0.1 /100 | #290 | Tragic $86,125 |
| Hispanics or Latinos | 0.1 /100 | #291 | Tragic $86,006 |
| Immigrants | Central America | 0.1 /100 | #292 | Tragic $85,965 |
| Comanche | 0.1 /100 | #293 | Tragic $85,787 |