English vs Icelander Per Capita Income
COMPARE
English
Icelander
Per Capita Income
Per Capita Income Comparison
English
Icelanders
$43,982
PER CAPITA INCOME
58.9/ 100
METRIC RATING
167th/ 347
METRIC RANK
$44,987
PER CAPITA INCOME
81.6/ 100
METRIC RATING
144th/ 347
METRIC RANK
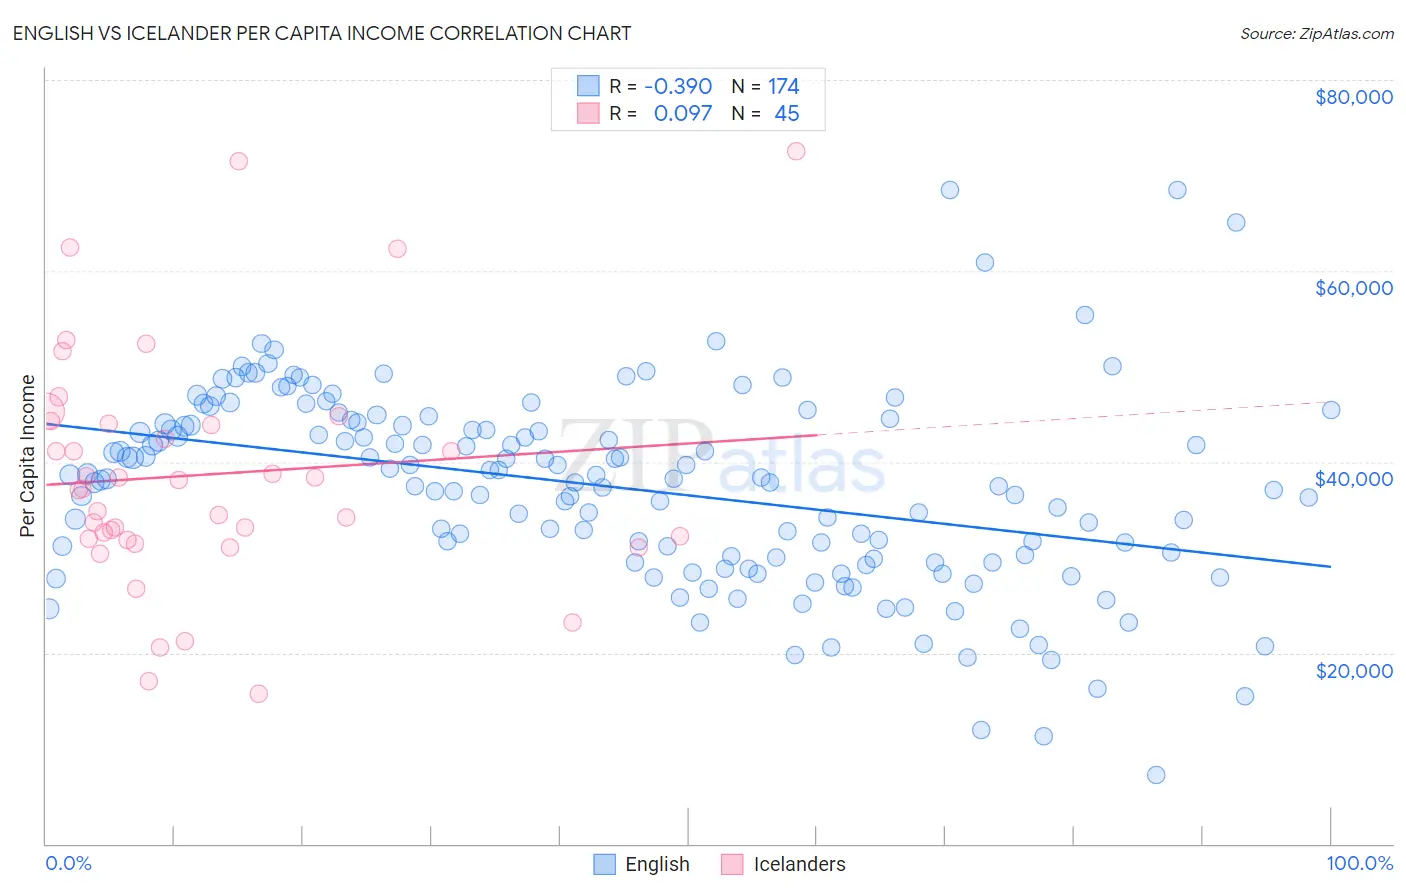
English vs Icelander Per Capita Income Correlation Chart
The statistical analysis conducted on geographies consisting of 580,041,700 people shows a mild negative correlation between the proportion of English and per capita income in the United States with a correlation coefficient (R) of -0.390 and weighted average of $43,982. Similarly, the statistical analysis conducted on geographies consisting of 159,668,759 people shows a slight positive correlation between the proportion of Icelanders and per capita income in the United States with a correlation coefficient (R) of 0.097 and weighted average of $44,987, a difference of 2.3%.
Per Capita Income Correlation Summary
| Measurement | English | Icelander |
| Minimum | $7,241 | $15,711 |
| Maximum | $68,486 | $72,483 |
| Range | $61,245 | $56,772 |
| Mean | $37,333 | $38,667 |
| Median | $38,254 | $37,248 |
| Interquartile 25% (IQ1) | $30,036 | $31,880 |
| Interquartile 75% (IQ3) | $44,055 | $44,123 |
| Interquartile Range (IQR) | $14,019 | $12,243 |
| Standard Deviation (Sample) | $10,214 | $12,398 |
| Standard Deviation (Population) | $10,184 | $12,260 |
Similar Demographics by Per Capita Income
Demographics Similar to English by Per Capita Income
In terms of per capita income, the demographic groups most similar to English are Immigrants from Uruguay ($43,997, a difference of 0.030%), Immigrants from Philippines ($44,000, a difference of 0.040%), Sri Lankan ($44,014, a difference of 0.070%), Belgian ($43,951, a difference of 0.070%), and Immigrants from South America ($44,068, a difference of 0.19%).
| Demographics | Rating | Rank | Per Capita Income |
| Danes | 61.9 /100 | #160 | Good $44,095 |
| Costa Ricans | 61.8 /100 | #161 | Good $44,090 |
| Swiss | 61.4 /100 | #162 | Good $44,076 |
| Immigrants | South America | 61.2 /100 | #163 | Good $44,068 |
| Sri Lankans | 59.8 /100 | #164 | Average $44,014 |
| Immigrants | Philippines | 59.4 /100 | #165 | Average $44,000 |
| Immigrants | Uruguay | 59.3 /100 | #166 | Average $43,997 |
| English | 58.9 /100 | #167 | Average $43,982 |
| Belgians | 58.1 /100 | #168 | Average $43,951 |
| Immigrants | Peru | 55.3 /100 | #169 | Average $43,852 |
| Scandinavians | 55.2 /100 | #170 | Average $43,848 |
| Immigrants | Eastern Africa | 54.9 /100 | #171 | Average $43,838 |
| Czechoslovakians | 54.1 /100 | #172 | Average $43,806 |
| French | 50.7 /100 | #173 | Average $43,685 |
| Colombians | 50.0 /100 | #174 | Average $43,661 |
Demographics Similar to Icelanders by Per Capita Income
In terms of per capita income, the demographic groups most similar to Icelanders are Immigrants from Uganda ($45,043, a difference of 0.12%), Ugandan ($45,047, a difference of 0.13%), Slavic ($45,049, a difference of 0.14%), Immigrants from Jordan ($45,066, a difference of 0.18%), and Basque ($45,086, a difference of 0.22%).
| Demographics | Rating | Rank | Per Capita Income |
| Immigrants | Syria | 85.2 /100 | #137 | Excellent $45,218 |
| Assyrians/Chaldeans/Syriacs | 84.8 /100 | #138 | Excellent $45,195 |
| Basques | 83.2 /100 | #139 | Excellent $45,086 |
| Immigrants | Jordan | 82.9 /100 | #140 | Excellent $45,066 |
| Slavs | 82.6 /100 | #141 | Excellent $45,049 |
| Ugandans | 82.6 /100 | #142 | Excellent $45,047 |
| Immigrants | Uganda | 82.5 /100 | #143 | Excellent $45,043 |
| Icelanders | 81.6 /100 | #144 | Excellent $44,987 |
| Immigrants | Afghanistan | 78.0 /100 | #145 | Good $44,790 |
| Irish | 75.8 /100 | #146 | Good $44,679 |
| Czechs | 74.1 /100 | #147 | Good $44,595 |
| Immigrants | Armenia | 73.1 /100 | #148 | Good $44,552 |
| Koreans | 72.5 /100 | #149 | Good $44,522 |
| Immigrants | Eritrea | 72.1 /100 | #150 | Good $44,509 |
| Norwegians | 71.5 /100 | #151 | Good $44,480 |