Spanish American Indian vs Icelander Per Capita Income
COMPARE
Spanish American Indian
Icelander
Per Capita Income
Per Capita Income Comparison
Spanish American Indians
Icelanders
$34,195
PER CAPITA INCOME
0.0/ 100
METRIC RATING
330th/ 347
METRIC RANK
$44,987
PER CAPITA INCOME
81.6/ 100
METRIC RATING
144th/ 347
METRIC RANK
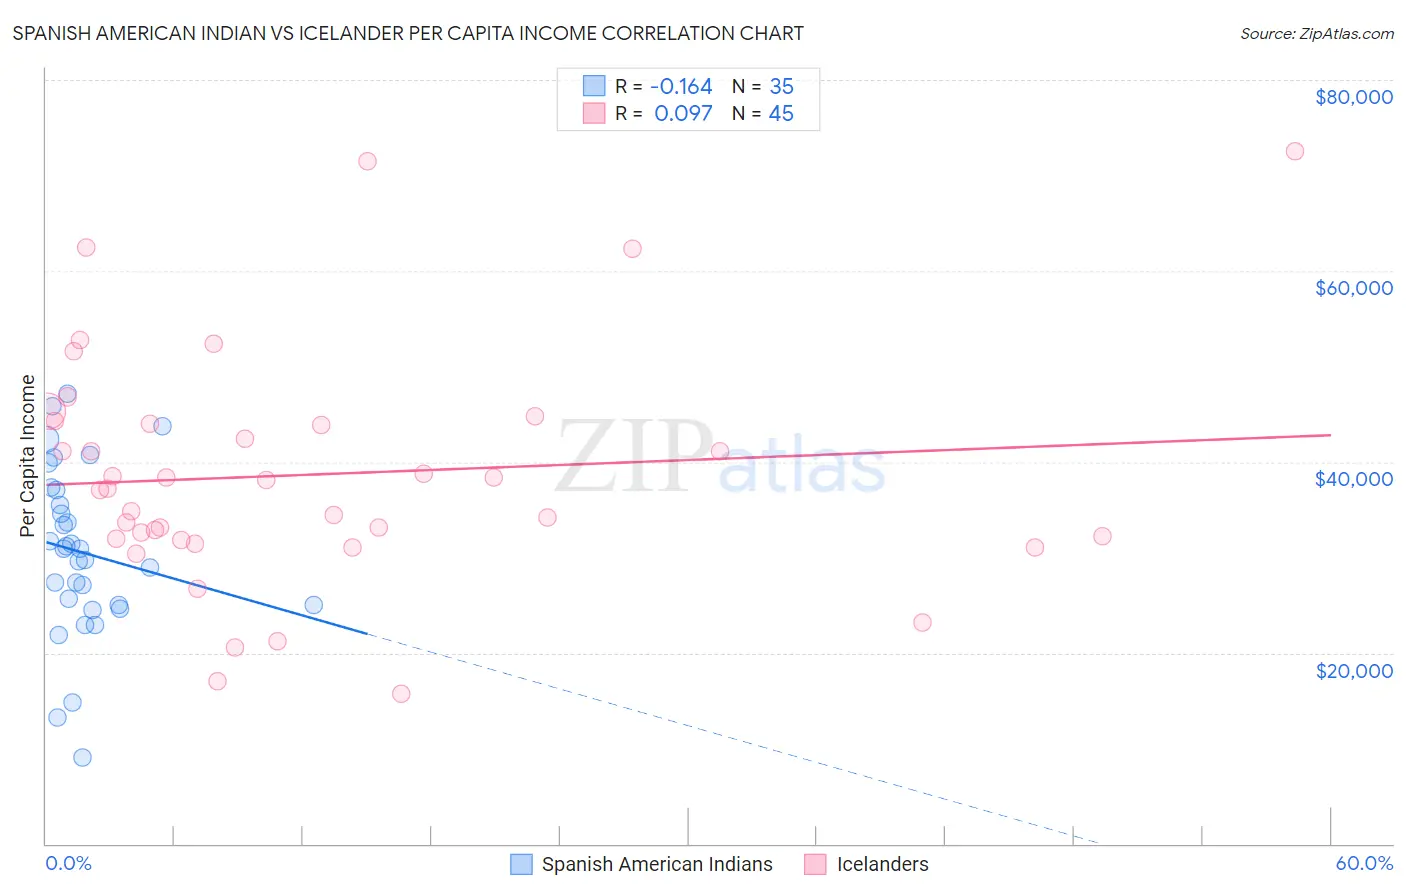
Spanish American Indian vs Icelander Per Capita Income Correlation Chart
The statistical analysis conducted on geographies consisting of 73,150,359 people shows a poor negative correlation between the proportion of Spanish American Indians and per capita income in the United States with a correlation coefficient (R) of -0.164 and weighted average of $34,195. Similarly, the statistical analysis conducted on geographies consisting of 159,668,759 people shows a slight positive correlation between the proportion of Icelanders and per capita income in the United States with a correlation coefficient (R) of 0.097 and weighted average of $44,987, a difference of 31.6%.
Per Capita Income Correlation Summary
| Measurement | Spanish American Indian | Icelander |
| Minimum | $9,061 | $15,711 |
| Maximum | $47,199 | $72,483 |
| Range | $38,138 | $56,772 |
| Mean | $30,495 | $38,667 |
| Median | $30,854 | $37,248 |
| Interquartile 25% (IQ1) | $24,953 | $31,880 |
| Interquartile 75% (IQ3) | $37,015 | $44,123 |
| Interquartile Range (IQR) | $12,062 | $12,243 |
| Standard Deviation (Sample) | $8,840 | $12,398 |
| Standard Deviation (Population) | $8,713 | $12,260 |
Similar Demographics by Per Capita Income
Demographics Similar to Spanish American Indians by Per Capita Income
In terms of per capita income, the demographic groups most similar to Spanish American Indians are Immigrants from Mexico ($33,931, a difference of 0.78%), Sioux ($33,921, a difference of 0.81%), Mexican ($34,559, a difference of 1.1%), Menominee ($34,578, a difference of 1.1%), and Immigrants from Yemen ($33,696, a difference of 1.5%).
| Demographics | Rating | Rank | Per Capita Income |
| Cheyenne | 0.0 /100 | #323 | Tragic $35,276 |
| Kiowa | 0.0 /100 | #324 | Tragic $35,102 |
| Immigrants | Central America | 0.0 /100 | #325 | Tragic $34,974 |
| Immigrants | Cuba | 0.0 /100 | #326 | Tragic $34,910 |
| Apache | 0.0 /100 | #327 | Tragic $34,886 |
| Menominee | 0.0 /100 | #328 | Tragic $34,578 |
| Mexicans | 0.0 /100 | #329 | Tragic $34,559 |
| Spanish American Indians | 0.0 /100 | #330 | Tragic $34,195 |
| Immigrants | Mexico | 0.0 /100 | #331 | Tragic $33,931 |
| Sioux | 0.0 /100 | #332 | Tragic $33,921 |
| Immigrants | Yemen | 0.0 /100 | #333 | Tragic $33,696 |
| Natives/Alaskans | 0.0 /100 | #334 | Tragic $33,279 |
| Yuman | 0.0 /100 | #335 | Tragic $33,236 |
| Yakama | 0.0 /100 | #336 | Tragic $33,009 |
| Houma | 0.0 /100 | #337 | Tragic $32,996 |
Demographics Similar to Icelanders by Per Capita Income
In terms of per capita income, the demographic groups most similar to Icelanders are Immigrants from Uganda ($45,043, a difference of 0.12%), Ugandan ($45,047, a difference of 0.13%), Slavic ($45,049, a difference of 0.14%), Immigrants from Jordan ($45,066, a difference of 0.18%), and Basque ($45,086, a difference of 0.22%).
| Demographics | Rating | Rank | Per Capita Income |
| Immigrants | Syria | 85.2 /100 | #137 | Excellent $45,218 |
| Assyrians/Chaldeans/Syriacs | 84.8 /100 | #138 | Excellent $45,195 |
| Basques | 83.2 /100 | #139 | Excellent $45,086 |
| Immigrants | Jordan | 82.9 /100 | #140 | Excellent $45,066 |
| Slavs | 82.6 /100 | #141 | Excellent $45,049 |
| Ugandans | 82.6 /100 | #142 | Excellent $45,047 |
| Immigrants | Uganda | 82.5 /100 | #143 | Excellent $45,043 |
| Icelanders | 81.6 /100 | #144 | Excellent $44,987 |
| Immigrants | Afghanistan | 78.0 /100 | #145 | Good $44,790 |
| Irish | 75.8 /100 | #146 | Good $44,679 |
| Czechs | 74.1 /100 | #147 | Good $44,595 |
| Immigrants | Armenia | 73.1 /100 | #148 | Good $44,552 |
| Koreans | 72.5 /100 | #149 | Good $44,522 |
| Immigrants | Eritrea | 72.1 /100 | #150 | Good $44,509 |
| Norwegians | 71.5 /100 | #151 | Good $44,480 |