Ute vs Comanche Householder Income Ages 25 - 44 years
COMPARE
Ute
Comanche
Householder Income Ages 25 - 44 years
Householder Income Ages 25 - 44 years Comparison
Ute
Comanche
$82,166
HOUSEHOLDER INCOME AGES 25 - 44 YEARS
0.1/ 100
METRIC RATING
286th/ 347
METRIC RANK
$82,152
HOUSEHOLDER INCOME AGES 25 - 44 YEARS
0.1/ 100
METRIC RATING
288th/ 347
METRIC RANK
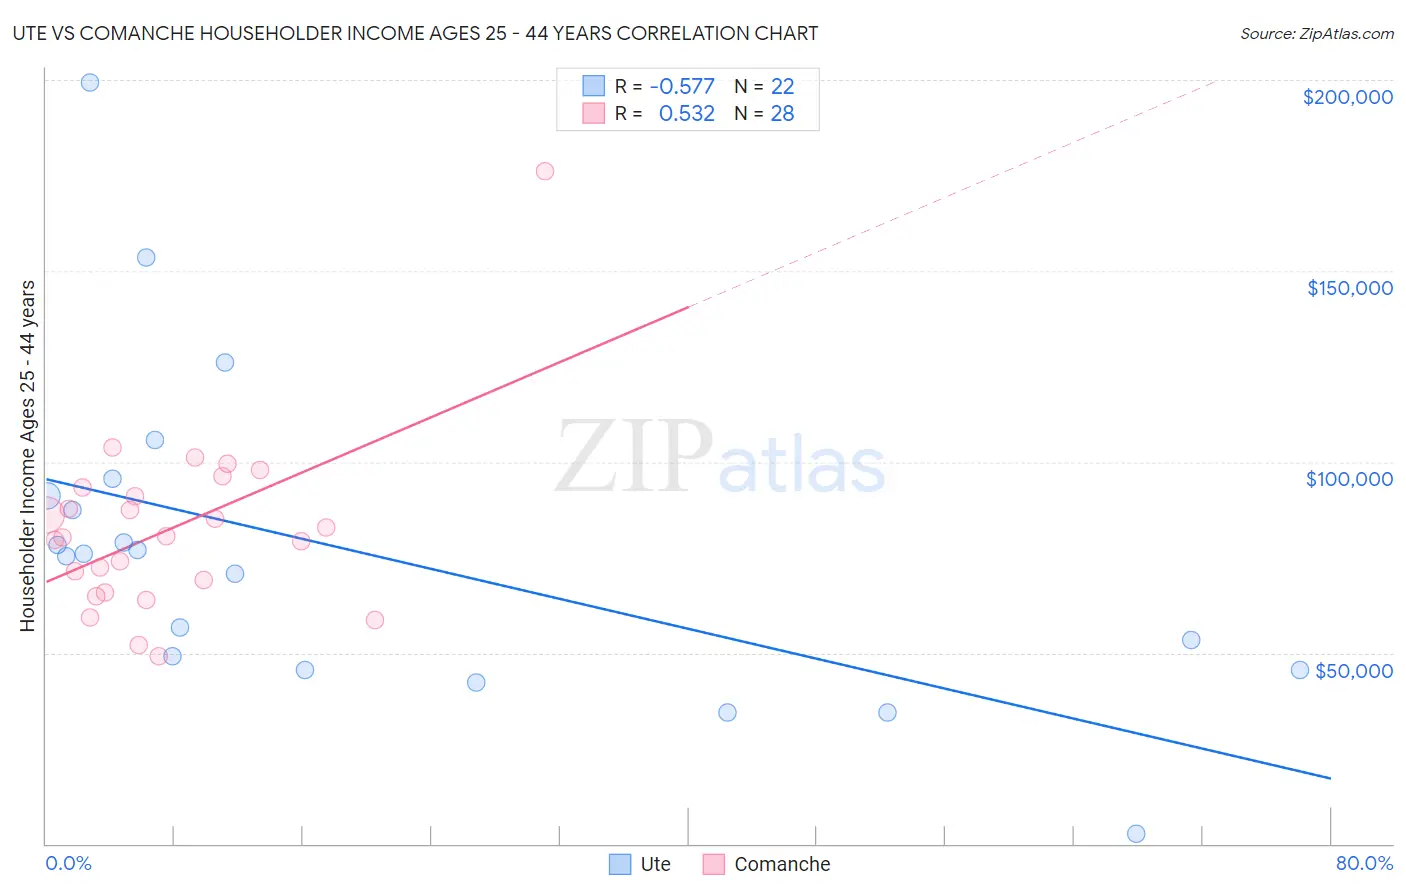
Ute vs Comanche Householder Income Ages 25 - 44 years Correlation Chart
The statistical analysis conducted on geographies consisting of 55,634,339 people shows a substantial negative correlation between the proportion of Ute and household income with householder between the ages 25 and 44 in the United States with a correlation coefficient (R) of -0.577 and weighted average of $82,166. Similarly, the statistical analysis conducted on geographies consisting of 109,664,910 people shows a substantial positive correlation between the proportion of Comanche and household income with householder between the ages 25 and 44 in the United States with a correlation coefficient (R) of 0.532 and weighted average of $82,152, a difference of 0.020%.
Householder Income Ages 25 - 44 years Correlation Summary
| Measurement | Ute | Comanche |
| Minimum | $2,499 | $49,171 |
| Maximum | $199,336 | $176,131 |
| Range | $196,837 | $126,960 |
| Mean | $76,298 | $82,424 |
| Median | $75,607 | $80,487 |
| Interquartile 25% (IQ1) | $45,625 | $67,374 |
| Interquartile 75% (IQ3) | $91,160 | $92,050 |
| Interquartile Range (IQR) | $45,535 | $24,676 |
| Standard Deviation (Sample) | $43,022 | $23,672 |
| Standard Deviation (Population) | $42,033 | $23,245 |
Demographics Similar to Ute and Comanche by Householder Income Ages 25 - 44 years
In terms of householder income ages 25 - 44 years, the demographic groups most similar to Ute are Immigrants from Latin America ($82,166, a difference of 0.0%), Immigrants from Somalia ($82,188, a difference of 0.030%), Immigrants from Middle Africa ($82,254, a difference of 0.11%), Shoshone ($82,062, a difference of 0.13%), and Guatemalan ($82,331, a difference of 0.20%). Similarly, the demographic groups most similar to Comanche are Immigrants from Latin America ($82,166, a difference of 0.020%), Immigrants from Somalia ($82,188, a difference of 0.040%), Shoshone ($82,062, a difference of 0.11%), Immigrants from Middle Africa ($82,254, a difference of 0.12%), and Liberian ($82,005, a difference of 0.18%).
| Demographics | Rating | Rank | Householder Income Ages 25 - 44 years |
| Paiute | 0.2 /100 | #277 | Tragic $82,984 |
| Senegalese | 0.2 /100 | #278 | Tragic $82,852 |
| Pima | 0.1 /100 | #279 | Tragic $82,821 |
| Colville | 0.1 /100 | #280 | Tragic $82,604 |
| Cajuns | 0.1 /100 | #281 | Tragic $82,393 |
| Central American Indians | 0.1 /100 | #282 | Tragic $82,355 |
| Guatemalans | 0.1 /100 | #283 | Tragic $82,331 |
| Immigrants | Middle Africa | 0.1 /100 | #284 | Tragic $82,254 |
| Immigrants | Somalia | 0.1 /100 | #285 | Tragic $82,188 |
| Ute | 0.1 /100 | #286 | Tragic $82,166 |
| Immigrants | Latin America | 0.1 /100 | #287 | Tragic $82,166 |
| Comanche | 0.1 /100 | #288 | Tragic $82,152 |
| Shoshone | 0.1 /100 | #289 | Tragic $82,062 |
| Liberians | 0.1 /100 | #290 | Tragic $82,005 |
| Potawatomi | 0.1 /100 | #291 | Tragic $81,774 |
| Yaqui | 0.1 /100 | #292 | Tragic $81,656 |
| Blackfeet | 0.1 /100 | #293 | Tragic $81,531 |
| Cubans | 0.1 /100 | #294 | Tragic $81,483 |
| Bangladeshis | 0.1 /100 | #295 | Tragic $81,363 |
| Immigrants | Dominica | 0.1 /100 | #296 | Tragic $81,351 |
| Immigrants | Guatemala | 0.1 /100 | #297 | Tragic $81,341 |