Native Hawaiian vs Comanche Householder Income Ages 25 - 44 years
COMPARE
Native Hawaiian
Comanche
Householder Income Ages 25 - 44 years
Householder Income Ages 25 - 44 years Comparison
Native Hawaiians
Comanche
$95,058
HOUSEHOLDER INCOME AGES 25 - 44 YEARS
56.8/ 100
METRIC RATING
169th/ 347
METRIC RANK
$82,152
HOUSEHOLDER INCOME AGES 25 - 44 YEARS
0.1/ 100
METRIC RATING
288th/ 347
METRIC RANK
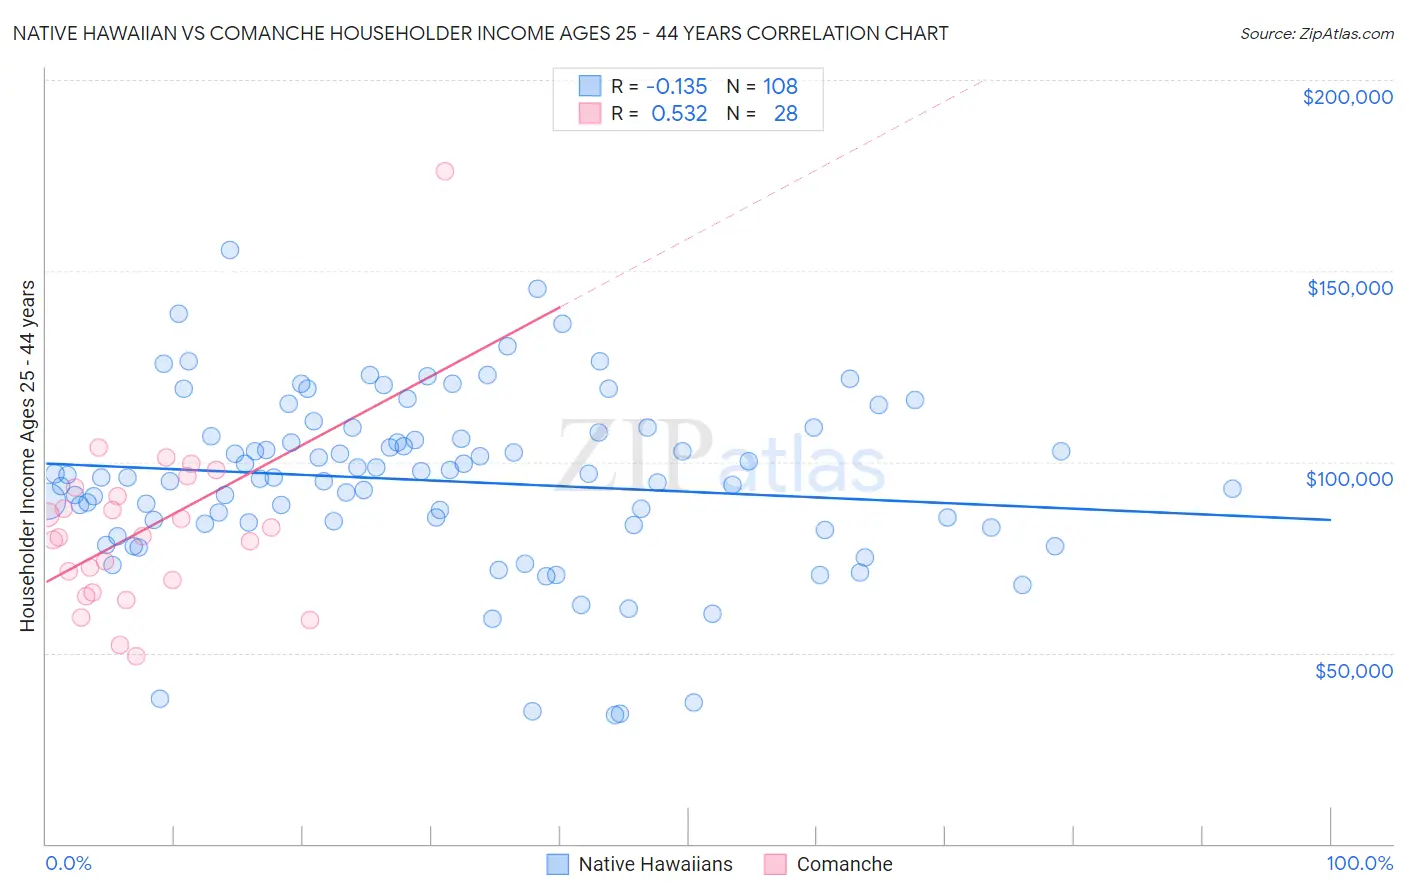
Native Hawaiian vs Comanche Householder Income Ages 25 - 44 years Correlation Chart
The statistical analysis conducted on geographies consisting of 331,204,844 people shows a poor negative correlation between the proportion of Native Hawaiians and household income with householder between the ages 25 and 44 in the United States with a correlation coefficient (R) of -0.135 and weighted average of $95,058. Similarly, the statistical analysis conducted on geographies consisting of 109,664,910 people shows a substantial positive correlation between the proportion of Comanche and household income with householder between the ages 25 and 44 in the United States with a correlation coefficient (R) of 0.532 and weighted average of $82,152, a difference of 15.7%.
Householder Income Ages 25 - 44 years Correlation Summary
| Measurement | Native Hawaiian | Comanche |
| Minimum | $33,592 | $49,171 |
| Maximum | $155,455 | $176,131 |
| Range | $121,863 | $126,960 |
| Mean | $95,050 | $82,424 |
| Median | $96,046 | $80,487 |
| Interquartile 25% (IQ1) | $84,012 | $67,374 |
| Interquartile 75% (IQ3) | $107,169 | $92,050 |
| Interquartile Range (IQR) | $23,157 | $24,676 |
| Standard Deviation (Sample) | $22,678 | $23,672 |
| Standard Deviation (Population) | $22,573 | $23,245 |
Similar Demographics by Householder Income Ages 25 - 44 years
Demographics Similar to Native Hawaiians by Householder Income Ages 25 - 44 years
In terms of householder income ages 25 - 44 years, the demographic groups most similar to Native Hawaiians are Alsatian ($95,059, a difference of 0.0%), Czechoslovakian ($95,070, a difference of 0.010%), Slovak ($95,032, a difference of 0.030%), Immigrants from Armenia ($94,867, a difference of 0.20%), and Immigrants from Ethiopia ($95,256, a difference of 0.21%).
| Demographics | Rating | Rank | Householder Income Ages 25 - 44 years |
| Swiss | 62.8 /100 | #162 | Good $95,511 |
| Immigrants | Saudi Arabia | 62.0 /100 | #163 | Good $95,450 |
| South Americans | 60.9 /100 | #164 | Good $95,362 |
| Immigrants | Nepal | 60.3 /100 | #165 | Good $95,322 |
| Immigrants | Ethiopia | 59.5 /100 | #166 | Average $95,256 |
| Czechoslovakians | 57.0 /100 | #167 | Average $95,070 |
| Alsatians | 56.8 /100 | #168 | Average $95,059 |
| Native Hawaiians | 56.8 /100 | #169 | Average $95,058 |
| Slovaks | 56.4 /100 | #170 | Average $95,032 |
| Immigrants | Armenia | 54.2 /100 | #171 | Average $94,867 |
| Scottish | 50.8 /100 | #172 | Average $94,622 |
| Finns | 50.6 /100 | #173 | Average $94,610 |
| Colombians | 50.0 /100 | #174 | Average $94,565 |
| English | 48.1 /100 | #175 | Average $94,429 |
| Immigrants | Immigrants | 48.0 /100 | #176 | Average $94,423 |
Demographics Similar to Comanche by Householder Income Ages 25 - 44 years
In terms of householder income ages 25 - 44 years, the demographic groups most similar to Comanche are Ute ($82,166, a difference of 0.020%), Immigrants from Latin America ($82,166, a difference of 0.020%), Immigrants from Somalia ($82,188, a difference of 0.040%), Shoshone ($82,062, a difference of 0.11%), and Immigrants from Middle Africa ($82,254, a difference of 0.12%).
| Demographics | Rating | Rank | Householder Income Ages 25 - 44 years |
| Cajuns | 0.1 /100 | #281 | Tragic $82,393 |
| Central American Indians | 0.1 /100 | #282 | Tragic $82,355 |
| Guatemalans | 0.1 /100 | #283 | Tragic $82,331 |
| Immigrants | Middle Africa | 0.1 /100 | #284 | Tragic $82,254 |
| Immigrants | Somalia | 0.1 /100 | #285 | Tragic $82,188 |
| Ute | 0.1 /100 | #286 | Tragic $82,166 |
| Immigrants | Latin America | 0.1 /100 | #287 | Tragic $82,166 |
| Comanche | 0.1 /100 | #288 | Tragic $82,152 |
| Shoshone | 0.1 /100 | #289 | Tragic $82,062 |
| Liberians | 0.1 /100 | #290 | Tragic $82,005 |
| Potawatomi | 0.1 /100 | #291 | Tragic $81,774 |
| Yaqui | 0.1 /100 | #292 | Tragic $81,656 |
| Blackfeet | 0.1 /100 | #293 | Tragic $81,531 |
| Cubans | 0.1 /100 | #294 | Tragic $81,483 |
| Bangladeshis | 0.1 /100 | #295 | Tragic $81,363 |