Immigrants from Morocco vs Comanche Householder Income Ages 25 - 44 years
COMPARE
Immigrants from Morocco
Comanche
Householder Income Ages 25 - 44 years
Householder Income Ages 25 - 44 years Comparison
Immigrants from Morocco
Comanche
$97,305
HOUSEHOLDER INCOME AGES 25 - 44 YEARS
82.0/ 100
METRIC RATING
140th/ 347
METRIC RANK
$82,152
HOUSEHOLDER INCOME AGES 25 - 44 YEARS
0.1/ 100
METRIC RATING
288th/ 347
METRIC RANK
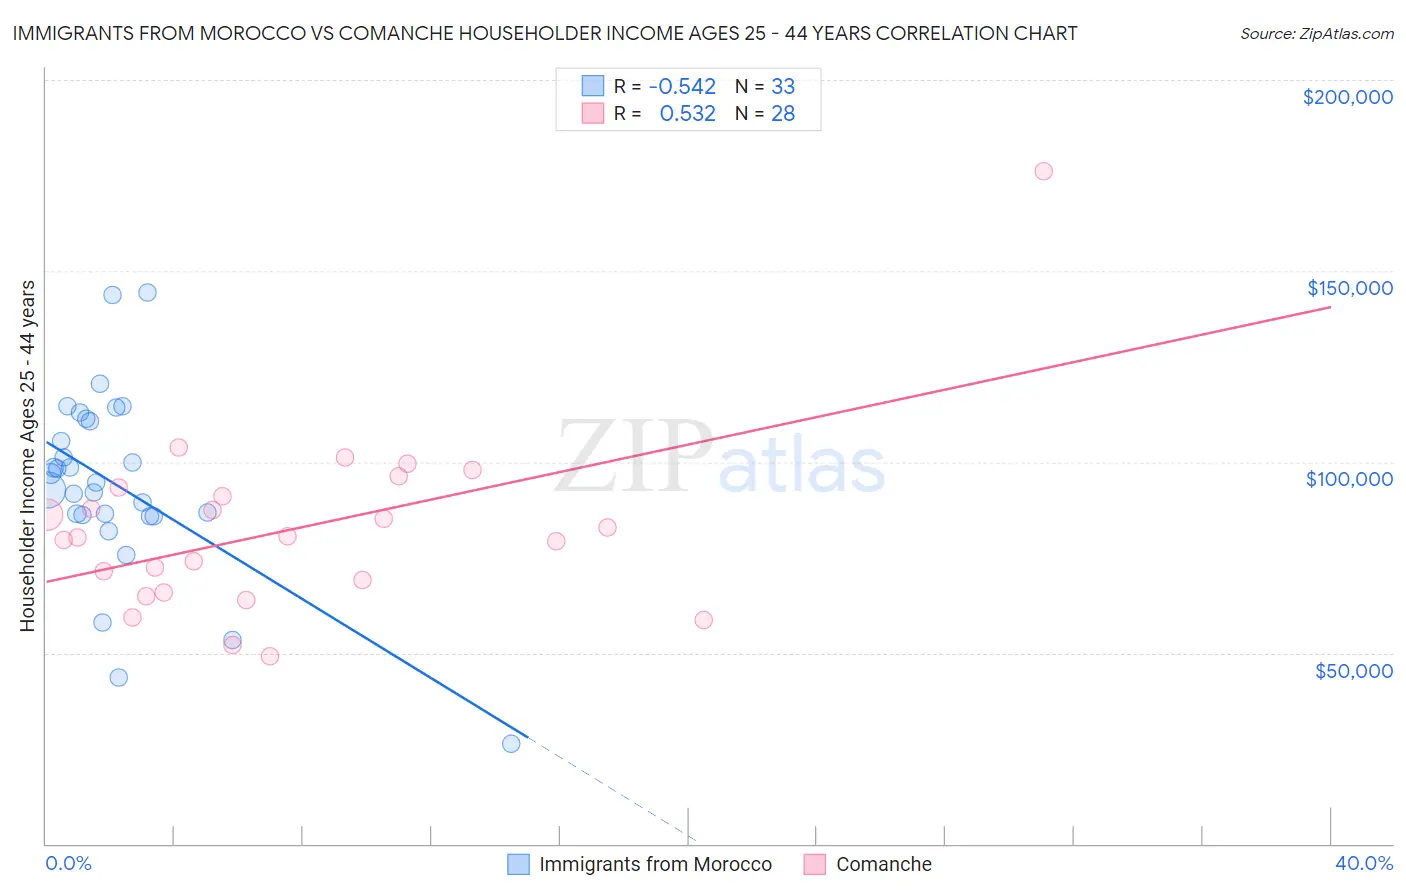
Immigrants from Morocco vs Comanche Householder Income Ages 25 - 44 years Correlation Chart
The statistical analysis conducted on geographies consisting of 178,797,729 people shows a substantial negative correlation between the proportion of Immigrants from Morocco and household income with householder between the ages 25 and 44 in the United States with a correlation coefficient (R) of -0.542 and weighted average of $97,305. Similarly, the statistical analysis conducted on geographies consisting of 109,664,910 people shows a substantial positive correlation between the proportion of Comanche and household income with householder between the ages 25 and 44 in the United States with a correlation coefficient (R) of 0.532 and weighted average of $82,152, a difference of 18.4%.
Householder Income Ages 25 - 44 years Correlation Summary
| Measurement | Immigrants from Morocco | Comanche |
| Minimum | $26,250 | $49,171 |
| Maximum | $144,345 | $176,131 |
| Range | $118,095 | $126,960 |
| Mean | $93,983 | $82,424 |
| Median | $94,739 | $80,487 |
| Interquartile 25% (IQ1) | $85,878 | $67,374 |
| Interquartile 75% (IQ3) | $111,008 | $92,050 |
| Interquartile Range (IQR) | $25,131 | $24,676 |
| Standard Deviation (Sample) | $24,483 | $23,672 |
| Standard Deviation (Population) | $24,109 | $23,245 |
Similar Demographics by Householder Income Ages 25 - 44 years
Demographics Similar to Immigrants from Morocco by Householder Income Ages 25 - 44 years
In terms of householder income ages 25 - 44 years, the demographic groups most similar to Immigrants from Morocco are Immigrants from Peru ($97,329, a difference of 0.020%), Lebanese ($97,339, a difference of 0.030%), Arab ($97,336, a difference of 0.030%), Luxembourger ($97,237, a difference of 0.070%), and Danish ($97,221, a difference of 0.090%).
| Demographics | Rating | Rank | Householder Income Ages 25 - 44 years |
| Tsimshian | 85.8 /100 | #133 | Excellent $97,809 |
| Canadians | 84.5 /100 | #134 | Excellent $97,625 |
| Immigrants | Oceania | 84.5 /100 | #135 | Excellent $97,623 |
| Hungarians | 83.9 /100 | #136 | Excellent $97,544 |
| Lebanese | 82.3 /100 | #137 | Excellent $97,339 |
| Arabs | 82.3 /100 | #138 | Excellent $97,336 |
| Immigrants | Peru | 82.2 /100 | #139 | Excellent $97,329 |
| Immigrants | Morocco | 82.0 /100 | #140 | Excellent $97,305 |
| Luxembourgers | 81.5 /100 | #141 | Excellent $97,237 |
| Danes | 81.3 /100 | #142 | Excellent $97,221 |
| Immigrants | Jordan | 81.0 /100 | #143 | Excellent $97,185 |
| Immigrants | Chile | 80.8 /100 | #144 | Excellent $97,159 |
| Norwegians | 78.2 /100 | #145 | Good $96,866 |
| Ethiopians | 77.8 /100 | #146 | Good $96,824 |
| Immigrants | Syria | 77.4 /100 | #147 | Good $96,789 |
Demographics Similar to Comanche by Householder Income Ages 25 - 44 years
In terms of householder income ages 25 - 44 years, the demographic groups most similar to Comanche are Ute ($82,166, a difference of 0.020%), Immigrants from Latin America ($82,166, a difference of 0.020%), Immigrants from Somalia ($82,188, a difference of 0.040%), Shoshone ($82,062, a difference of 0.11%), and Immigrants from Middle Africa ($82,254, a difference of 0.12%).
| Demographics | Rating | Rank | Householder Income Ages 25 - 44 years |
| Cajuns | 0.1 /100 | #281 | Tragic $82,393 |
| Central American Indians | 0.1 /100 | #282 | Tragic $82,355 |
| Guatemalans | 0.1 /100 | #283 | Tragic $82,331 |
| Immigrants | Middle Africa | 0.1 /100 | #284 | Tragic $82,254 |
| Immigrants | Somalia | 0.1 /100 | #285 | Tragic $82,188 |
| Ute | 0.1 /100 | #286 | Tragic $82,166 |
| Immigrants | Latin America | 0.1 /100 | #287 | Tragic $82,166 |
| Comanche | 0.1 /100 | #288 | Tragic $82,152 |
| Shoshone | 0.1 /100 | #289 | Tragic $82,062 |
| Liberians | 0.1 /100 | #290 | Tragic $82,005 |
| Potawatomi | 0.1 /100 | #291 | Tragic $81,774 |
| Yaqui | 0.1 /100 | #292 | Tragic $81,656 |
| Blackfeet | 0.1 /100 | #293 | Tragic $81,531 |
| Cubans | 0.1 /100 | #294 | Tragic $81,483 |
| Bangladeshis | 0.1 /100 | #295 | Tragic $81,363 |