Ute vs Immigrants from Ethiopia Median Household Income
COMPARE
Ute
Immigrants from Ethiopia
Median Household Income
Median Household Income Comparison
Ute
Immigrants from Ethiopia
$72,402
MEDIAN HOUSEHOLD INCOME
0.0/ 100
METRIC RATING
307th/ 347
METRIC RANK
$88,687
MEDIAN HOUSEHOLD INCOME
90.9/ 100
METRIC RATING
133rd/ 347
METRIC RANK
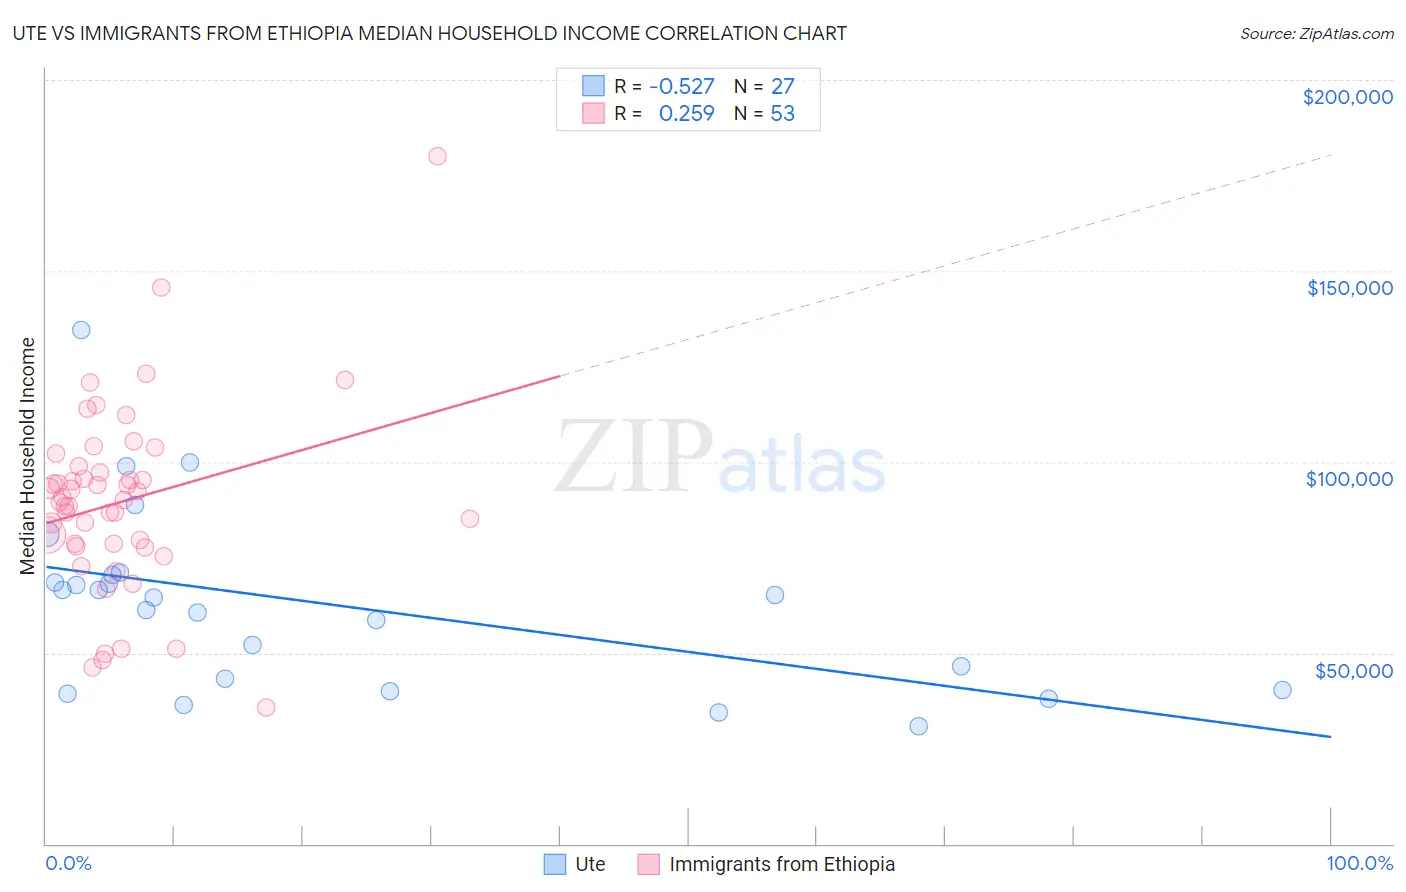
Ute vs Immigrants from Ethiopia Median Household Income Correlation Chart
The statistical analysis conducted on geographies consisting of 55,657,610 people shows a substantial negative correlation between the proportion of Ute and median household income in the United States with a correlation coefficient (R) of -0.527 and weighted average of $72,402. Similarly, the statistical analysis conducted on geographies consisting of 211,436,017 people shows a weak positive correlation between the proportion of Immigrants from Ethiopia and median household income in the United States with a correlation coefficient (R) of 0.259 and weighted average of $88,687, a difference of 22.5%.
Median Household Income Correlation Summary
| Measurement | Ute | Immigrants from Ethiopia |
| Minimum | $30,694 | $35,809 |
| Maximum | $134,629 | $180,167 |
| Range | $103,935 | $144,358 |
| Mean | $62,668 | $89,607 |
| Median | $64,375 | $90,025 |
| Interquartile 25% (IQ1) | $40,417 | $78,327 |
| Interquartile 75% (IQ3) | $70,252 | $98,118 |
| Interquartile Range (IQR) | $29,835 | $19,791 |
| Standard Deviation (Sample) | $23,676 | $24,432 |
| Standard Deviation (Population) | $23,234 | $24,200 |
Similar Demographics by Median Household Income
Demographics Similar to Ute by Median Household Income
In terms of median household income, the demographic groups most similar to Ute are Potawatomi ($72,576, a difference of 0.24%), Yakama ($72,225, a difference of 0.25%), Honduran ($72,588, a difference of 0.26%), Immigrants from Haiti ($72,599, a difference of 0.27%), and African ($72,650, a difference of 0.34%).
| Demographics | Rating | Rank | Median Household Income |
| Immigrants | Dominica | 0.0 /100 | #300 | Tragic $72,760 |
| Cherokee | 0.0 /100 | #301 | Tragic $72,682 |
| Shoshone | 0.0 /100 | #302 | Tragic $72,660 |
| Africans | 0.0 /100 | #303 | Tragic $72,650 |
| Immigrants | Haiti | 0.0 /100 | #304 | Tragic $72,599 |
| Hondurans | 0.0 /100 | #305 | Tragic $72,588 |
| Potawatomi | 0.0 /100 | #306 | Tragic $72,576 |
| Ute | 0.0 /100 | #307 | Tragic $72,402 |
| Yakama | 0.0 /100 | #308 | Tragic $72,225 |
| Immigrants | Caribbean | 0.0 /100 | #309 | Tragic $71,860 |
| U.S. Virgin Islanders | 0.0 /100 | #310 | Tragic $71,853 |
| Immigrants | Zaire | 0.0 /100 | #311 | Tragic $71,801 |
| Immigrants | Honduras | 0.0 /100 | #312 | Tragic $71,452 |
| Immigrants | Bahamas | 0.0 /100 | #313 | Tragic $71,349 |
| Dominicans | 0.0 /100 | #314 | Tragic $71,302 |
Demographics Similar to Immigrants from Ethiopia by Median Household Income
In terms of median household income, the demographic groups most similar to Immigrants from Ethiopia are European ($88,751, a difference of 0.070%), Immigrants from Syria ($88,792, a difference of 0.12%), Swedish ($88,524, a difference of 0.18%), Immigrants from Sierra Leone ($88,498, a difference of 0.21%), and Polish ($88,472, a difference of 0.24%).
| Demographics | Rating | Rank | Median Household Income |
| Immigrants | Oceania | 92.9 /100 | #126 | Exceptional $89,100 |
| Immigrants | Peru | 92.5 /100 | #127 | Exceptional $89,010 |
| Portuguese | 92.3 /100 | #128 | Exceptional $88,976 |
| Brazilians | 92.1 /100 | #129 | Exceptional $88,934 |
| British | 92.0 /100 | #130 | Exceptional $88,914 |
| Immigrants | Syria | 91.4 /100 | #131 | Exceptional $88,792 |
| Europeans | 91.2 /100 | #132 | Exceptional $88,751 |
| Immigrants | Ethiopia | 90.9 /100 | #133 | Exceptional $88,687 |
| Swedes | 90.0 /100 | #134 | Exceptional $88,524 |
| Immigrants | Sierra Leone | 89.9 /100 | #135 | Excellent $88,498 |
| Poles | 89.7 /100 | #136 | Excellent $88,472 |
| Sierra Leoneans | 89.6 /100 | #137 | Excellent $88,463 |
| Arabs | 89.2 /100 | #138 | Excellent $88,398 |
| Immigrants | Chile | 89.2 /100 | #139 | Excellent $88,388 |
| Lebanese | 87.2 /100 | #140 | Excellent $88,091 |