Marshallese vs Chinese Householder Income Ages 45 - 64 years
COMPARE
Marshallese
Chinese
Householder Income Ages 45 - 64 years
Householder Income Ages 45 - 64 years Comparison
Marshallese
Chinese
$90,455
HOUSEHOLDER INCOME AGES 45 - 64 YEARS
0.7/ 100
METRIC RATING
252nd/ 347
METRIC RANK
$116,156
HOUSEHOLDER INCOME AGES 45 - 64 YEARS
100.0/ 100
METRIC RATING
33rd/ 347
METRIC RANK
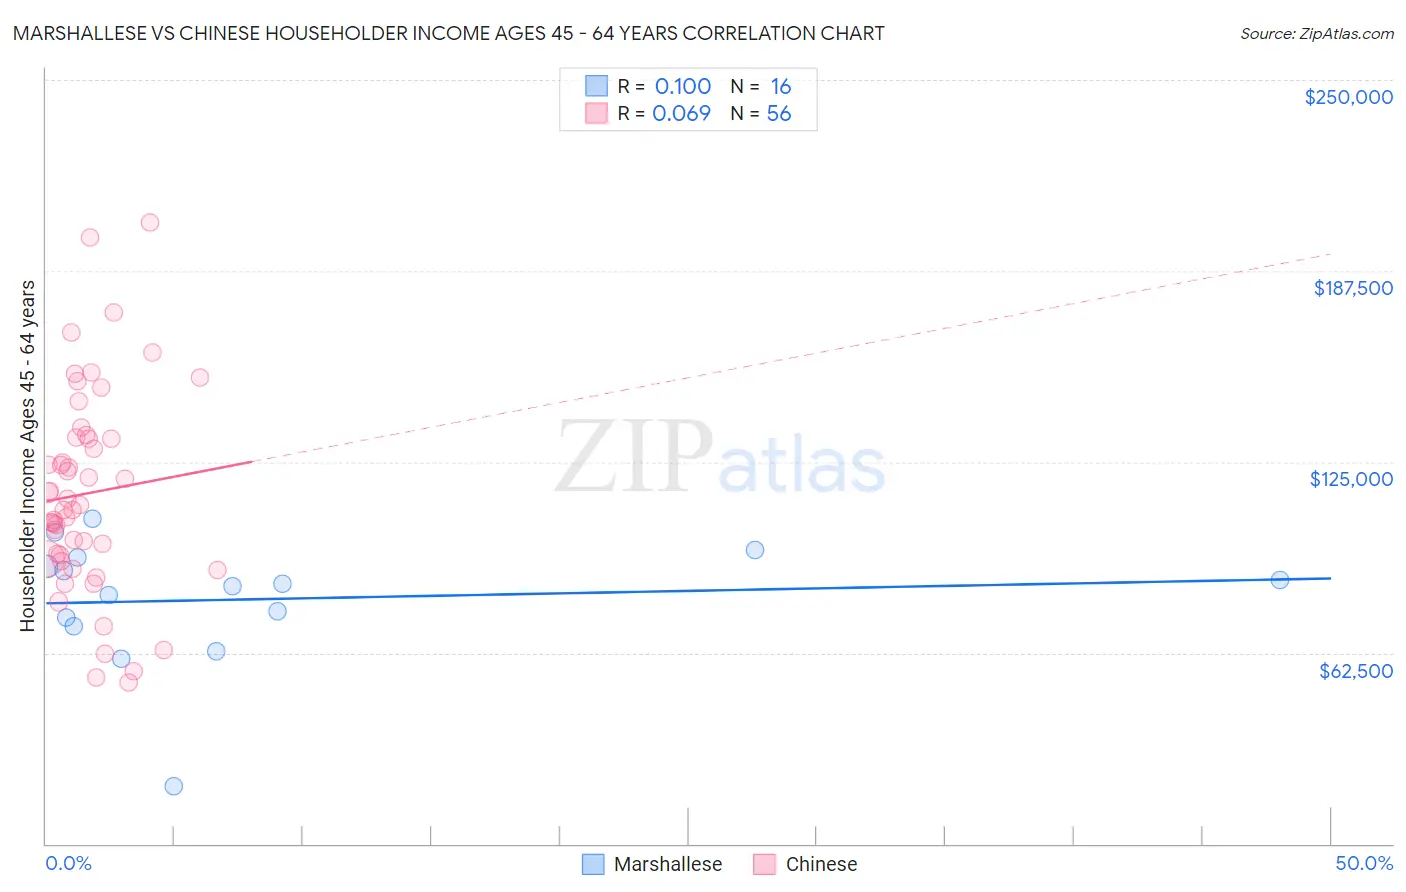
Marshallese vs Chinese Householder Income Ages 45 - 64 years Correlation Chart
The statistical analysis conducted on geographies consisting of 14,751,694 people shows a slight positive correlation between the proportion of Marshallese and household income with householder between the ages 45 and 64 in the United States with a correlation coefficient (R) of 0.100 and weighted average of $90,455. Similarly, the statistical analysis conducted on geographies consisting of 64,773,263 people shows a slight positive correlation between the proportion of Chinese and household income with householder between the ages 45 and 64 in the United States with a correlation coefficient (R) of 0.069 and weighted average of $116,156, a difference of 28.4%.
Householder Income Ages 45 - 64 years Correlation Summary
| Measurement | Marshallese | Chinese |
| Minimum | $18,640 | $52,969 |
| Maximum | $106,252 | $203,211 |
| Range | $87,612 | $150,242 |
| Mean | $79,964 | $114,652 |
| Median | $84,819 | $110,020 |
| Interquartile 25% (IQ1) | $72,758 | $93,748 |
| Interquartile 75% (IQ3) | $92,231 | $132,670 |
| Interquartile Range (IQR) | $19,473 | $38,922 |
| Standard Deviation (Sample) | $20,771 | $33,042 |
| Standard Deviation (Population) | $20,112 | $32,746 |
Similar Demographics by Householder Income Ages 45 - 64 years
Demographics Similar to Marshallese by Householder Income Ages 45 - 64 years
In terms of householder income ages 45 - 64 years, the demographic groups most similar to Marshallese are American ($90,536, a difference of 0.090%), Barbadian ($90,266, a difference of 0.21%), Subsaharan African ($90,691, a difference of 0.26%), Immigrants from Guyana ($90,186, a difference of 0.30%), and Mexican American Indian ($90,811, a difference of 0.39%).
| Demographics | Rating | Rank | Householder Income Ages 45 - 64 years |
| Guyanese | 0.9 /100 | #245 | Tragic $90,966 |
| Central Americans | 0.9 /100 | #246 | Tragic $90,951 |
| Alaskan Athabascans | 0.9 /100 | #247 | Tragic $90,951 |
| Immigrants | Laos | 0.9 /100 | #248 | Tragic $90,909 |
| Mexican American Indians | 0.8 /100 | #249 | Tragic $90,811 |
| Sub-Saharan Africans | 0.8 /100 | #250 | Tragic $90,691 |
| Americans | 0.7 /100 | #251 | Tragic $90,536 |
| Marshallese | 0.7 /100 | #252 | Tragic $90,455 |
| Barbadians | 0.6 /100 | #253 | Tragic $90,266 |
| Immigrants | Guyana | 0.6 /100 | #254 | Tragic $90,186 |
| West Indians | 0.5 /100 | #255 | Tragic $89,906 |
| French American Indians | 0.5 /100 | #256 | Tragic $89,811 |
| German Russians | 0.4 /100 | #257 | Tragic $89,398 |
| Immigrants | Barbados | 0.4 /100 | #258 | Tragic $89,394 |
| Immigrants | Nicaragua | 0.4 /100 | #259 | Tragic $89,108 |
Demographics Similar to Chinese by Householder Income Ages 45 - 64 years
In terms of householder income ages 45 - 64 years, the demographic groups most similar to Chinese are Immigrants from Denmark ($116,000, a difference of 0.13%), Russian ($116,328, a difference of 0.15%), Latvian ($115,957, a difference of 0.17%), Immigrants from Switzerland ($115,934, a difference of 0.19%), and Immigrants from Asia ($116,566, a difference of 0.35%).
| Demographics | Rating | Rank | Householder Income Ages 45 - 64 years |
| Immigrants | Sweden | 100.0 /100 | #26 | Exceptional $118,318 |
| Immigrants | Northern Europe | 100.0 /100 | #27 | Exceptional $117,930 |
| Turks | 100.0 /100 | #28 | Exceptional $117,814 |
| Bhutanese | 100.0 /100 | #29 | Exceptional $117,750 |
| Immigrants | Bolivia | 100.0 /100 | #30 | Exceptional $117,731 |
| Immigrants | Asia | 100.0 /100 | #31 | Exceptional $116,566 |
| Russians | 100.0 /100 | #32 | Exceptional $116,328 |
| Chinese | 100.0 /100 | #33 | Exceptional $116,156 |
| Immigrants | Denmark | 100.0 /100 | #34 | Exceptional $116,000 |
| Latvians | 100.0 /100 | #35 | Exceptional $115,957 |
| Immigrants | Switzerland | 100.0 /100 | #36 | Exceptional $115,934 |
| Maltese | 99.9 /100 | #37 | Exceptional $114,754 |
| Immigrants | Pakistan | 99.9 /100 | #38 | Exceptional $114,434 |
| Immigrants | Turkey | 99.9 /100 | #39 | Exceptional $114,407 |
| Cambodians | 99.9 /100 | #40 | Exceptional $114,342 |