Uruguayan vs Yaqui Median Household Income
COMPARE
Uruguayan
Yaqui
Median Household Income
Median Household Income Comparison
Uruguayans
Yaqui
$84,691
MEDIAN HOUSEHOLD INCOME
43.5/ 100
METRIC RATING
182nd/ 347
METRIC RANK
$74,596
MEDIAN HOUSEHOLD INCOME
0.1/ 100
METRIC RATING
284th/ 347
METRIC RANK
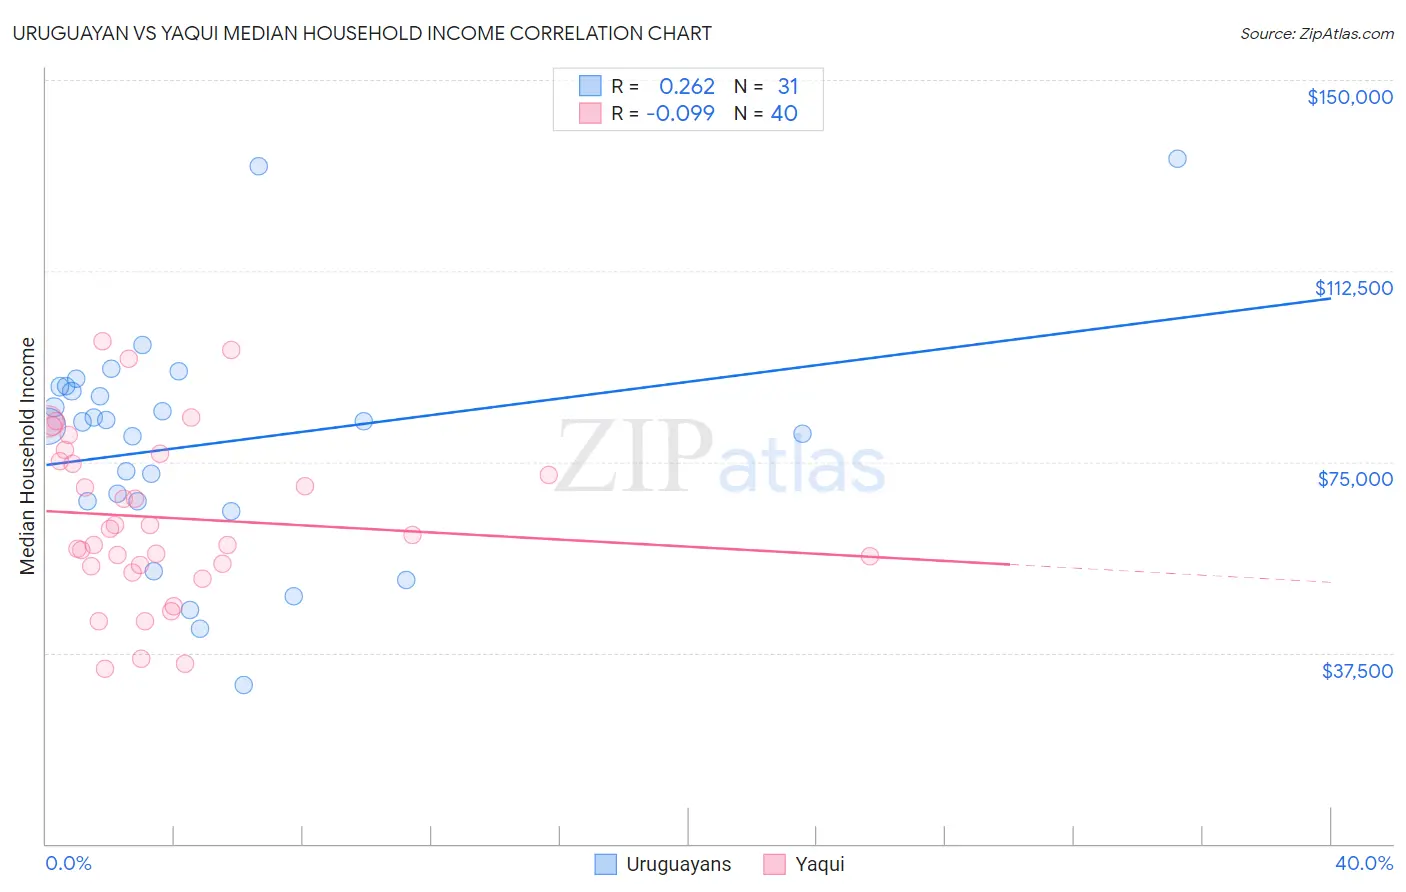
Uruguayan vs Yaqui Median Household Income Correlation Chart
The statistical analysis conducted on geographies consisting of 144,748,959 people shows a weak positive correlation between the proportion of Uruguayans and median household income in the United States with a correlation coefficient (R) of 0.262 and weighted average of $84,691. Similarly, the statistical analysis conducted on geographies consisting of 107,719,305 people shows a slight negative correlation between the proportion of Yaqui and median household income in the United States with a correlation coefficient (R) of -0.099 and weighted average of $74,596, a difference of 13.5%.
Median Household Income Correlation Summary
| Measurement | Uruguayan | Yaqui |
| Minimum | $31,250 | $34,415 |
| Maximum | $134,635 | $98,754 |
| Range | $103,385 | $64,339 |
| Mean | $78,489 | $64,033 |
| Median | $82,857 | $61,231 |
| Interquartile 25% (IQ1) | $67,190 | $54,573 |
| Interquartile 75% (IQ3) | $89,740 | $75,863 |
| Interquartile Range (IQR) | $22,550 | $21,290 |
| Standard Deviation (Sample) | $22,490 | $16,401 |
| Standard Deviation (Population) | $22,125 | $16,195 |
Similar Demographics by Median Household Income
Demographics Similar to Uruguayans by Median Household Income
In terms of median household income, the demographic groups most similar to Uruguayans are Hawaiian ($84,729, a difference of 0.040%), Immigrants from Portugal ($84,740, a difference of 0.060%), Spaniard ($84,644, a difference of 0.060%), English ($84,915, a difference of 0.26%), and Czechoslovakian ($84,965, a difference of 0.32%).
| Demographics | Rating | Rank | Median Household Income |
| Immigrants | Costa Rica | 49.2 /100 | #175 | Average $85,054 |
| Alsatians | 49.2 /100 | #176 | Average $85,053 |
| Immigrants | Eritrea | 48.8 /100 | #177 | Average $85,025 |
| Czechoslovakians | 47.8 /100 | #178 | Average $84,965 |
| English | 47.0 /100 | #179 | Average $84,915 |
| Immigrants | Portugal | 44.2 /100 | #180 | Average $84,740 |
| Hawaiians | 44.1 /100 | #181 | Average $84,729 |
| Uruguayans | 43.5 /100 | #182 | Average $84,691 |
| Spaniards | 42.7 /100 | #183 | Average $84,644 |
| Immigrants | Eastern Africa | 37.4 /100 | #184 | Fair $84,299 |
| Kenyans | 34.2 /100 | #185 | Fair $84,085 |
| Puget Sound Salish | 33.2 /100 | #186 | Fair $84,011 |
| Belgians | 33.2 /100 | #187 | Fair $84,008 |
| Tlingit-Haida | 32.6 /100 | #188 | Fair $83,968 |
| Immigrants | Colombia | 31.7 /100 | #189 | Fair $83,902 |
Demographics Similar to Yaqui by Median Household Income
In terms of median household income, the demographic groups most similar to Yaqui are Cree ($74,685, a difference of 0.12%), Mexican ($74,399, a difference of 0.26%), Central American Indian ($74,847, a difference of 0.34%), Immigrants from Liberia ($74,896, a difference of 0.40%), and Immigrants from Somalia ($74,300, a difference of 0.40%).
| Demographics | Rating | Rank | Median Household Income |
| Spanish Americans | 0.2 /100 | #277 | Tragic $75,386 |
| Osage | 0.2 /100 | #278 | Tragic $75,240 |
| Immigrants | Guatemala | 0.2 /100 | #279 | Tragic $75,123 |
| Senegalese | 0.2 /100 | #280 | Tragic $74,999 |
| Immigrants | Liberia | 0.1 /100 | #281 | Tragic $74,896 |
| Central American Indians | 0.1 /100 | #282 | Tragic $74,847 |
| Cree | 0.1 /100 | #283 | Tragic $74,685 |
| Yaqui | 0.1 /100 | #284 | Tragic $74,596 |
| Mexicans | 0.1 /100 | #285 | Tragic $74,399 |
| Immigrants | Somalia | 0.1 /100 | #286 | Tragic $74,300 |
| Iroquois | 0.1 /100 | #287 | Tragic $74,279 |
| Immigrants | Central America | 0.1 /100 | #288 | Tragic $74,217 |
| Fijians | 0.1 /100 | #289 | Tragic $74,205 |
| Bangladeshis | 0.1 /100 | #290 | Tragic $74,112 |
| Hispanics or Latinos | 0.1 /100 | #291 | Tragic $73,823 |