Ukrainian vs Pueblo Median Family Income
COMPARE
Ukrainian
Pueblo
Median Family Income
Median Family Income Comparison
Ukrainians
Pueblo
$111,368
MEDIAN FAMILY INCOME
98.8/ 100
METRIC RATING
86th/ 347
METRIC RANK
$76,880
MEDIAN FAMILY INCOME
0.0/ 100
METRIC RATING
341st/ 347
METRIC RANK
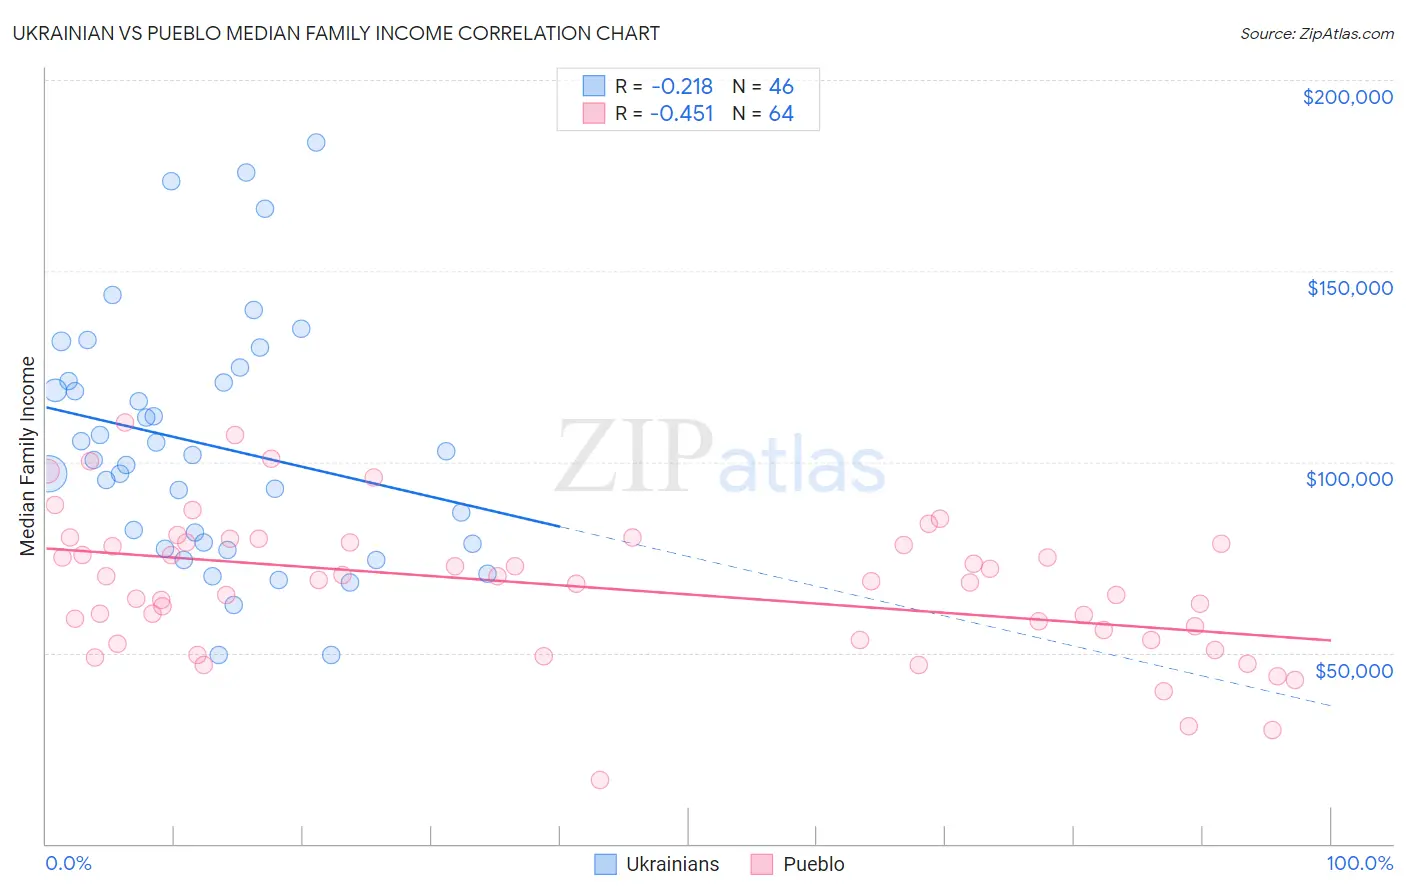
Ukrainian vs Pueblo Median Family Income Correlation Chart
The statistical analysis conducted on geographies consisting of 448,126,657 people shows a weak negative correlation between the proportion of Ukrainians and median family income in the United States with a correlation coefficient (R) of -0.218 and weighted average of $111,368. Similarly, the statistical analysis conducted on geographies consisting of 120,047,767 people shows a moderate negative correlation between the proportion of Pueblo and median family income in the United States with a correlation coefficient (R) of -0.451 and weighted average of $76,880, a difference of 44.9%.
Median Family Income Correlation Summary
| Measurement | Ukrainian | Pueblo |
| Minimum | $49,418 | $16,806 |
| Maximum | $183,477 | $110,375 |
| Range | $134,059 | $93,569 |
| Mean | $104,354 | $67,508 |
| Median | $101,148 | $68,832 |
| Interquartile 25% (IQ1) | $78,581 | $54,583 |
| Interquartile 75% (IQ3) | $121,262 | $78,820 |
| Interquartile Range (IQR) | $42,681 | $24,237 |
| Standard Deviation (Sample) | $32,156 | $18,534 |
| Standard Deviation (Population) | $31,804 | $18,389 |
Similar Demographics by Median Family Income
Demographics Similar to Ukrainians by Median Family Income
In terms of median family income, the demographic groups most similar to Ukrainians are Croatian ($111,370, a difference of 0.0%), Immigrants from Hungary ($111,378, a difference of 0.010%), Austrian ($111,306, a difference of 0.060%), Romanian ($111,243, a difference of 0.11%), and Immigrants from Egypt ($111,689, a difference of 0.29%).
| Demographics | Rating | Rank | Median Family Income |
| Italians | 99.3 /100 | #79 | Exceptional $112,372 |
| Immigrants | Croatia | 99.3 /100 | #80 | Exceptional $112,323 |
| Immigrants | North America | 99.2 /100 | #81 | Exceptional $112,151 |
| Immigrants | England | 99.2 /100 | #82 | Exceptional $112,038 |
| Immigrants | Egypt | 99.0 /100 | #83 | Exceptional $111,689 |
| Immigrants | Hungary | 98.8 /100 | #84 | Exceptional $111,378 |
| Croatians | 98.8 /100 | #85 | Exceptional $111,370 |
| Ukrainians | 98.8 /100 | #86 | Exceptional $111,368 |
| Austrians | 98.8 /100 | #87 | Exceptional $111,306 |
| Romanians | 98.8 /100 | #88 | Exceptional $111,243 |
| Immigrants | Argentina | 98.5 /100 | #89 | Exceptional $110,873 |
| Northern Europeans | 98.3 /100 | #90 | Exceptional $110,635 |
| Immigrants | Southern Europe | 98.3 /100 | #91 | Exceptional $110,614 |
| Immigrants | Lebanon | 97.9 /100 | #92 | Exceptional $110,159 |
| Immigrants | Kazakhstan | 97.8 /100 | #93 | Exceptional $110,137 |
Demographics Similar to Pueblo by Median Family Income
In terms of median family income, the demographic groups most similar to Pueblo are Crow ($76,605, a difference of 0.36%), Hopi ($77,188, a difference of 0.40%), Pima ($77,431, a difference of 0.72%), Immigrants from Yemen ($77,457, a difference of 0.75%), and Houma ($76,188, a difference of 0.91%).
| Demographics | Rating | Rank | Median Family Income |
| Kiowa | 0.0 /100 | #333 | Tragic $80,885 |
| Menominee | 0.0 /100 | #334 | Tragic $79,563 |
| Yup'ik | 0.0 /100 | #335 | Tragic $79,290 |
| Immigrants | Cuba | 0.0 /100 | #336 | Tragic $78,249 |
| Yuman | 0.0 /100 | #337 | Tragic $78,055 |
| Immigrants | Yemen | 0.0 /100 | #338 | Tragic $77,457 |
| Pima | 0.0 /100 | #339 | Tragic $77,431 |
| Hopi | 0.0 /100 | #340 | Tragic $77,188 |
| Pueblo | 0.0 /100 | #341 | Tragic $76,880 |
| Crow | 0.0 /100 | #342 | Tragic $76,605 |
| Houma | 0.0 /100 | #343 | Tragic $76,188 |
| Tohono O'odham | 0.0 /100 | #344 | Tragic $72,193 |
| Navajo | 0.0 /100 | #345 | Tragic $70,989 |
| Puerto Ricans | 0.0 /100 | #346 | Tragic $70,423 |
| Lumbee | 0.0 /100 | #347 | Tragic $68,679 |